- DCIM?
- What is DCIM?
- What is a Colocation Data Center?
- What is the Federal Data Center Optimization Initiative (DCOI)?
- What is Data Center Management?
- What is Second-Generation DCIM?
- What is Data Center Monitoring?
- What is Data Center Service Management (DCSM)?
- What is Network Documentation?
- What is an Edge Data Center?
- What is a Data Center CMDB?
- What is Data Center Automation?
- How do I get started?
- Products
- Service
- Resources
- Support
- Company
- Search


Product Screenshots
-
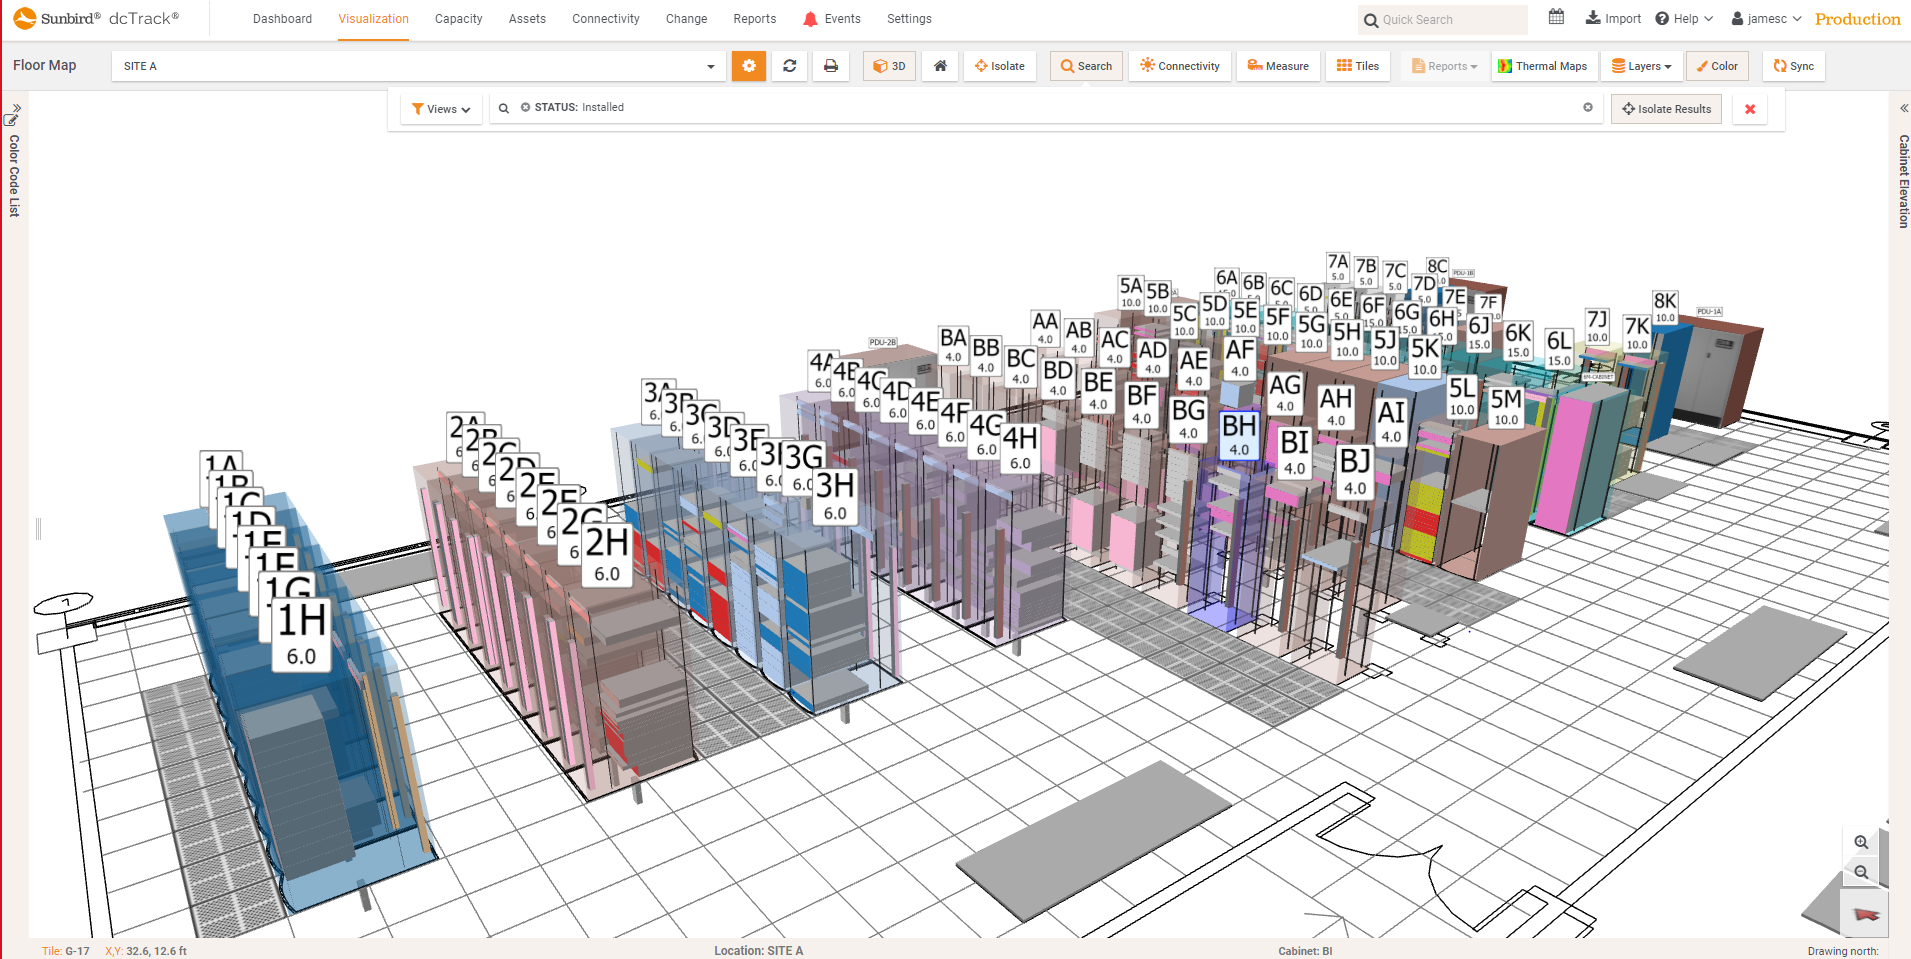
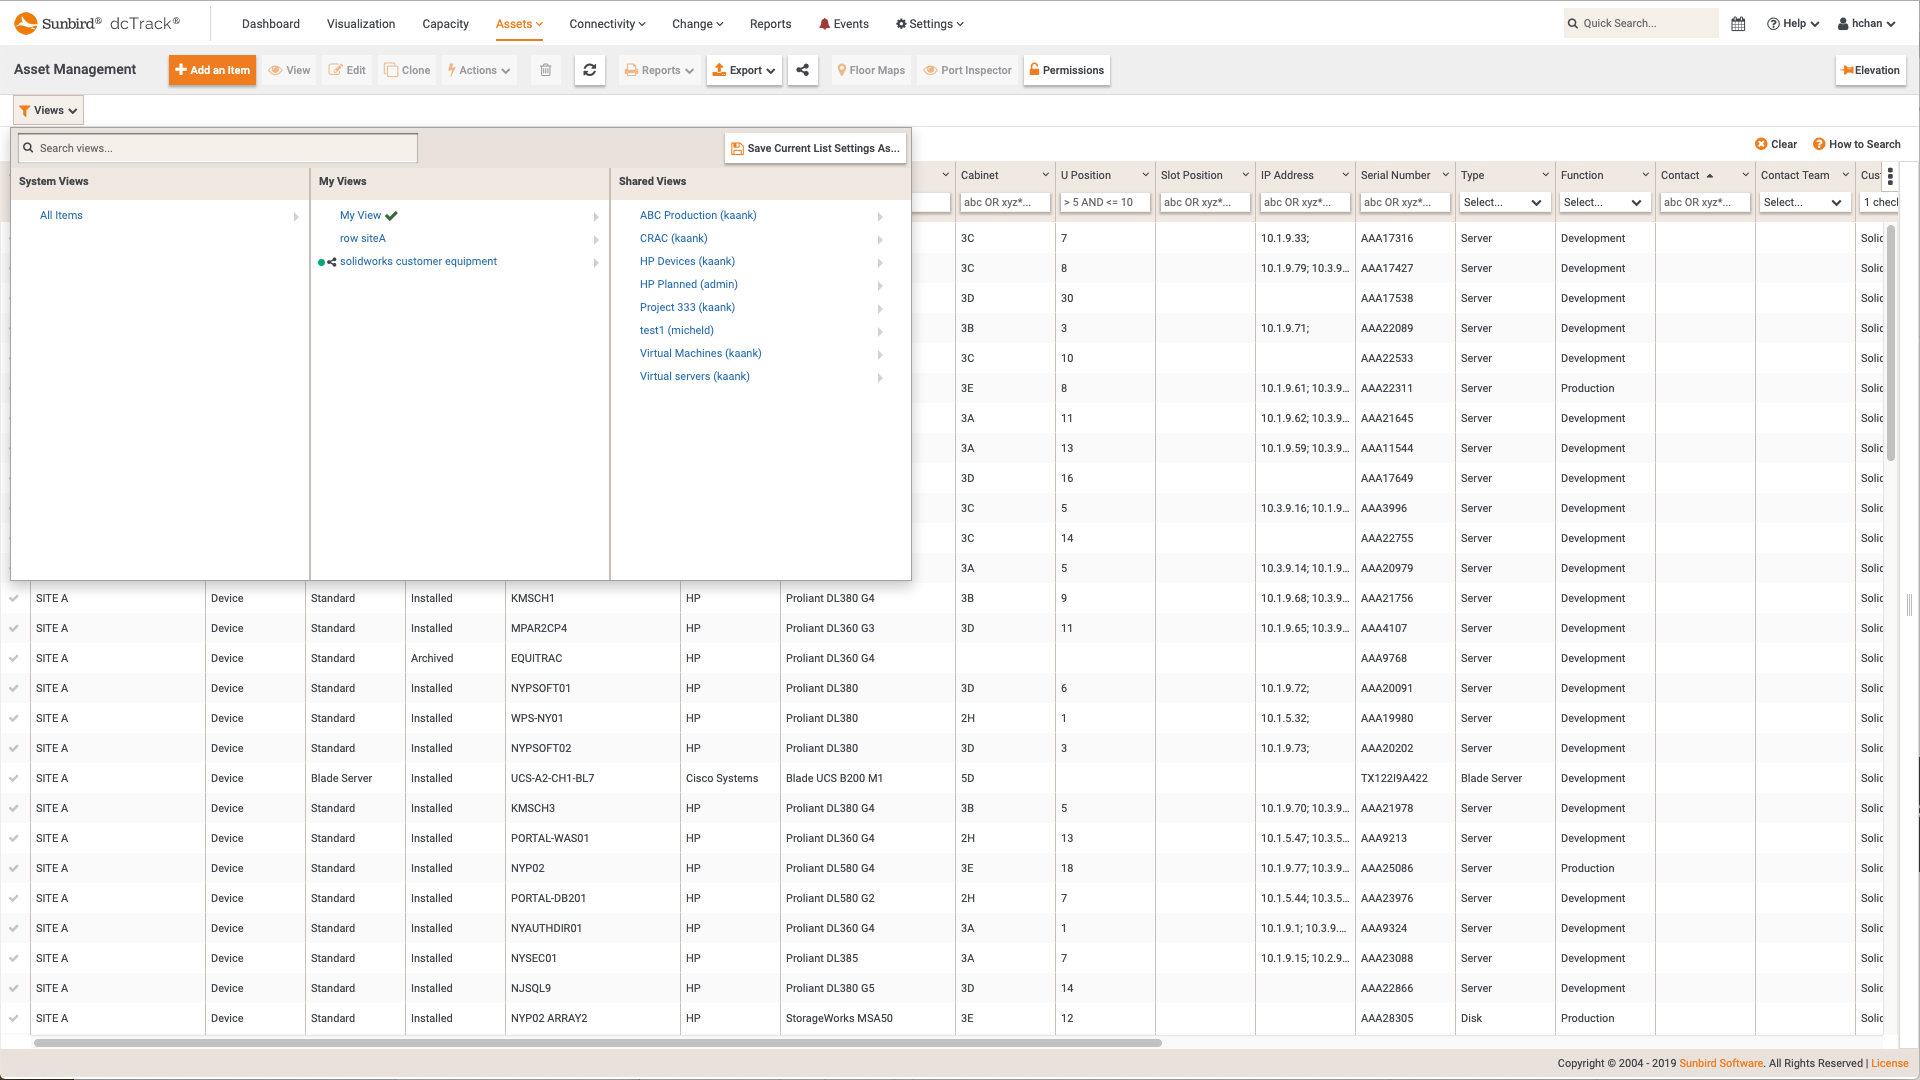
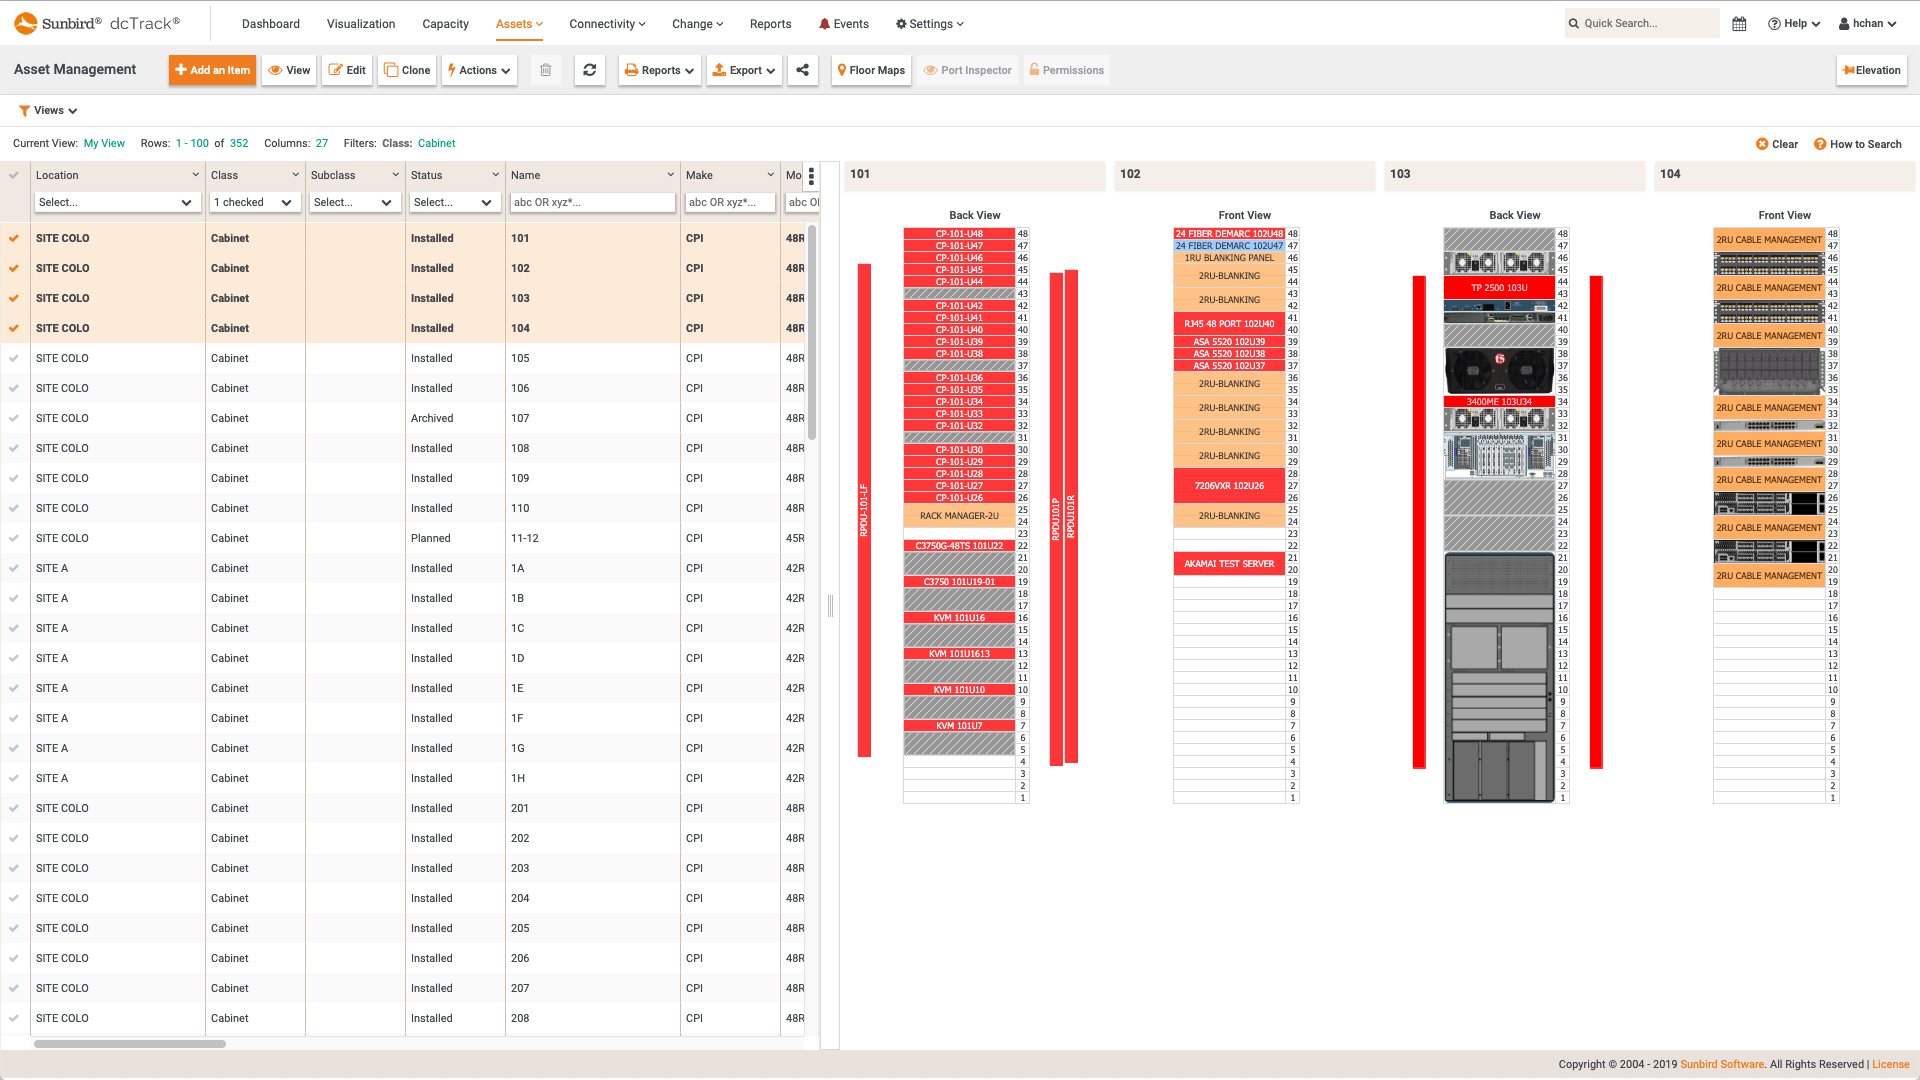
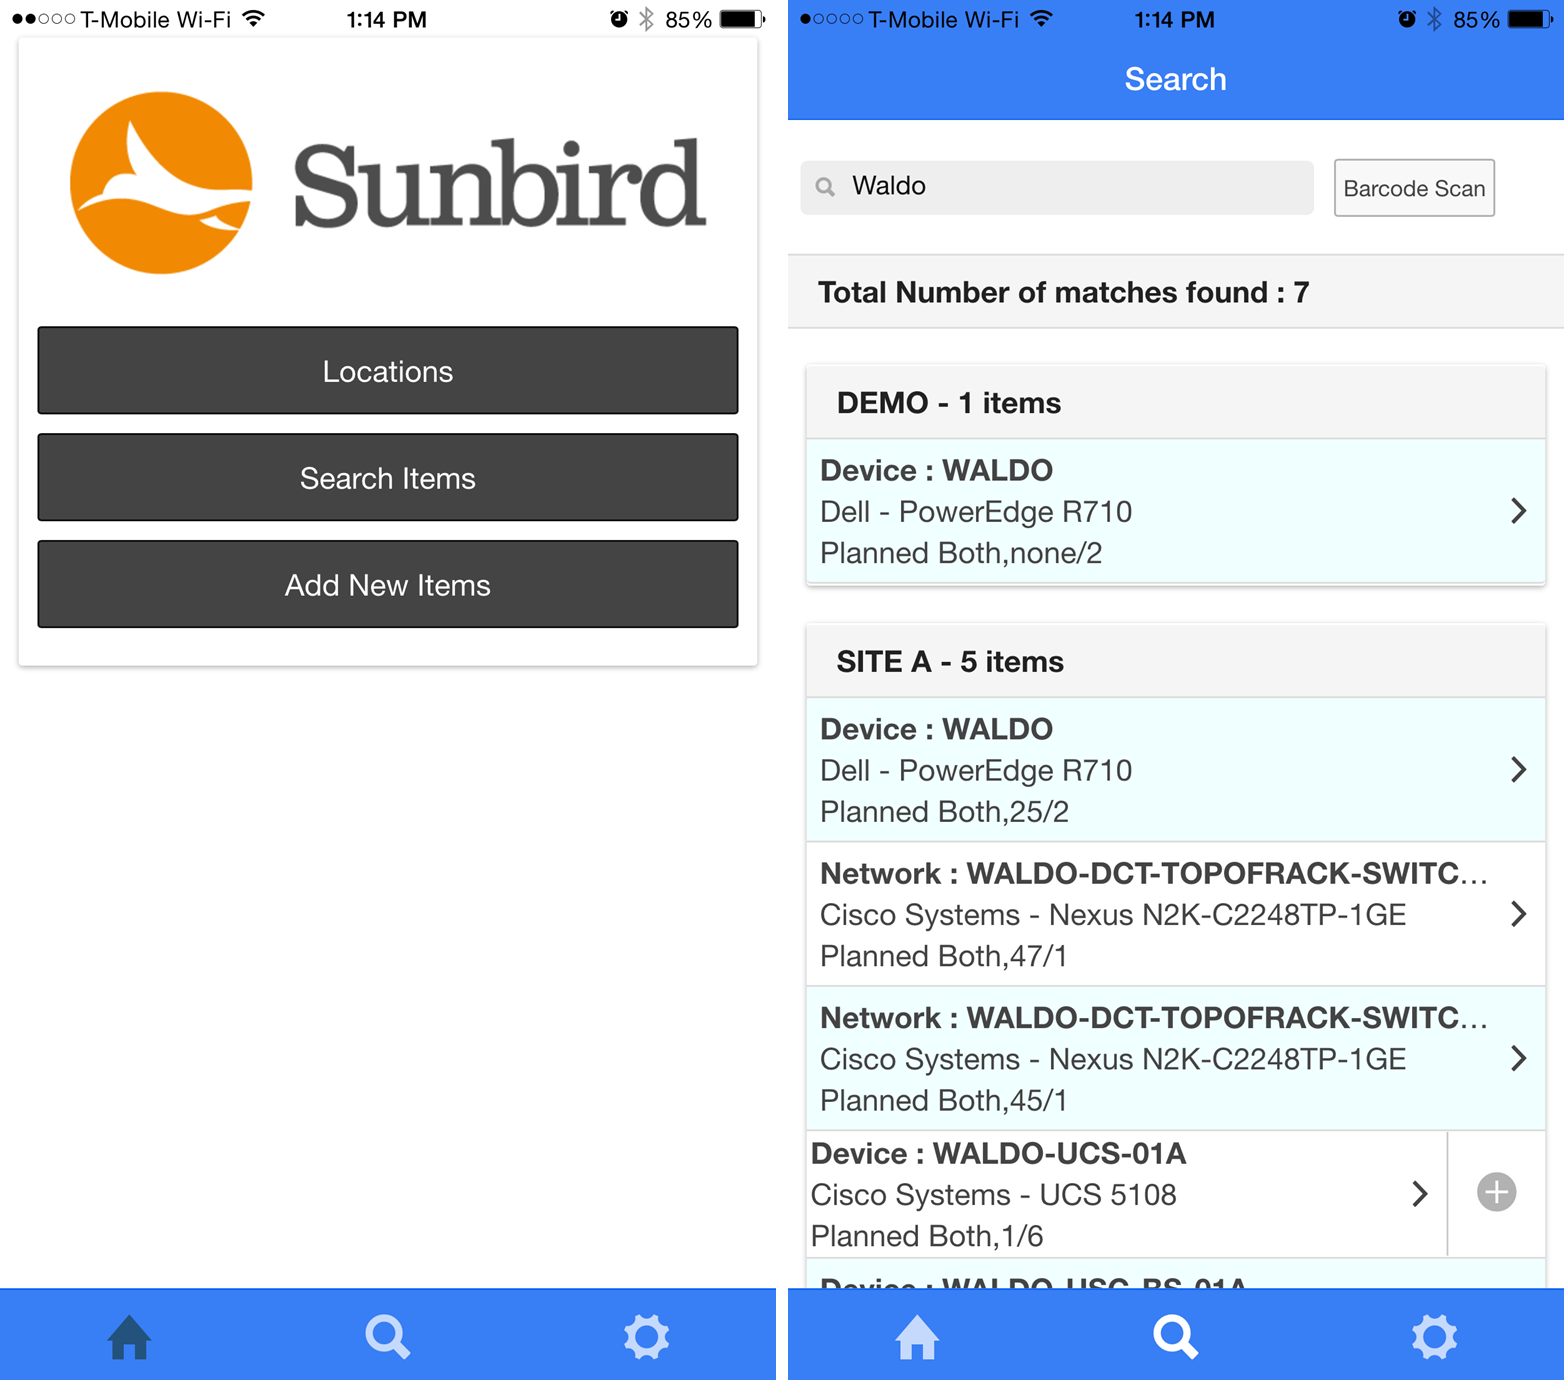
 dcTrack DCIM Operations | Visualization | Asset ManagementColor-Coded Floor Map Search Results
 -
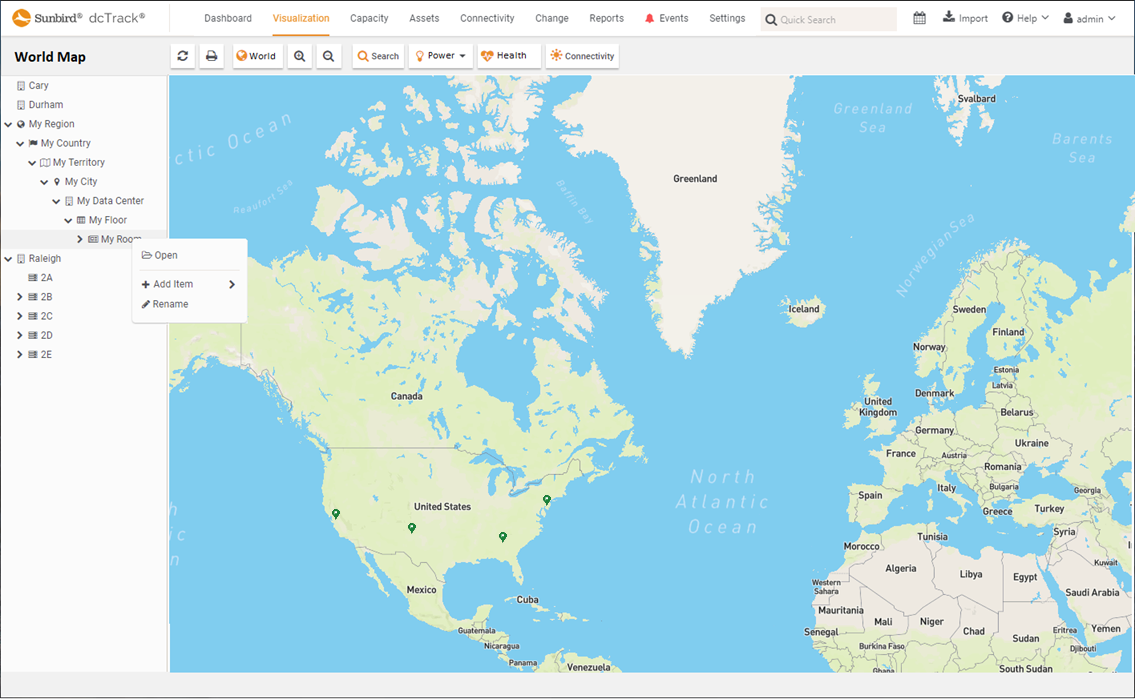
 dcTrack DCIM Operations | VisualizationData Center World Map
 -
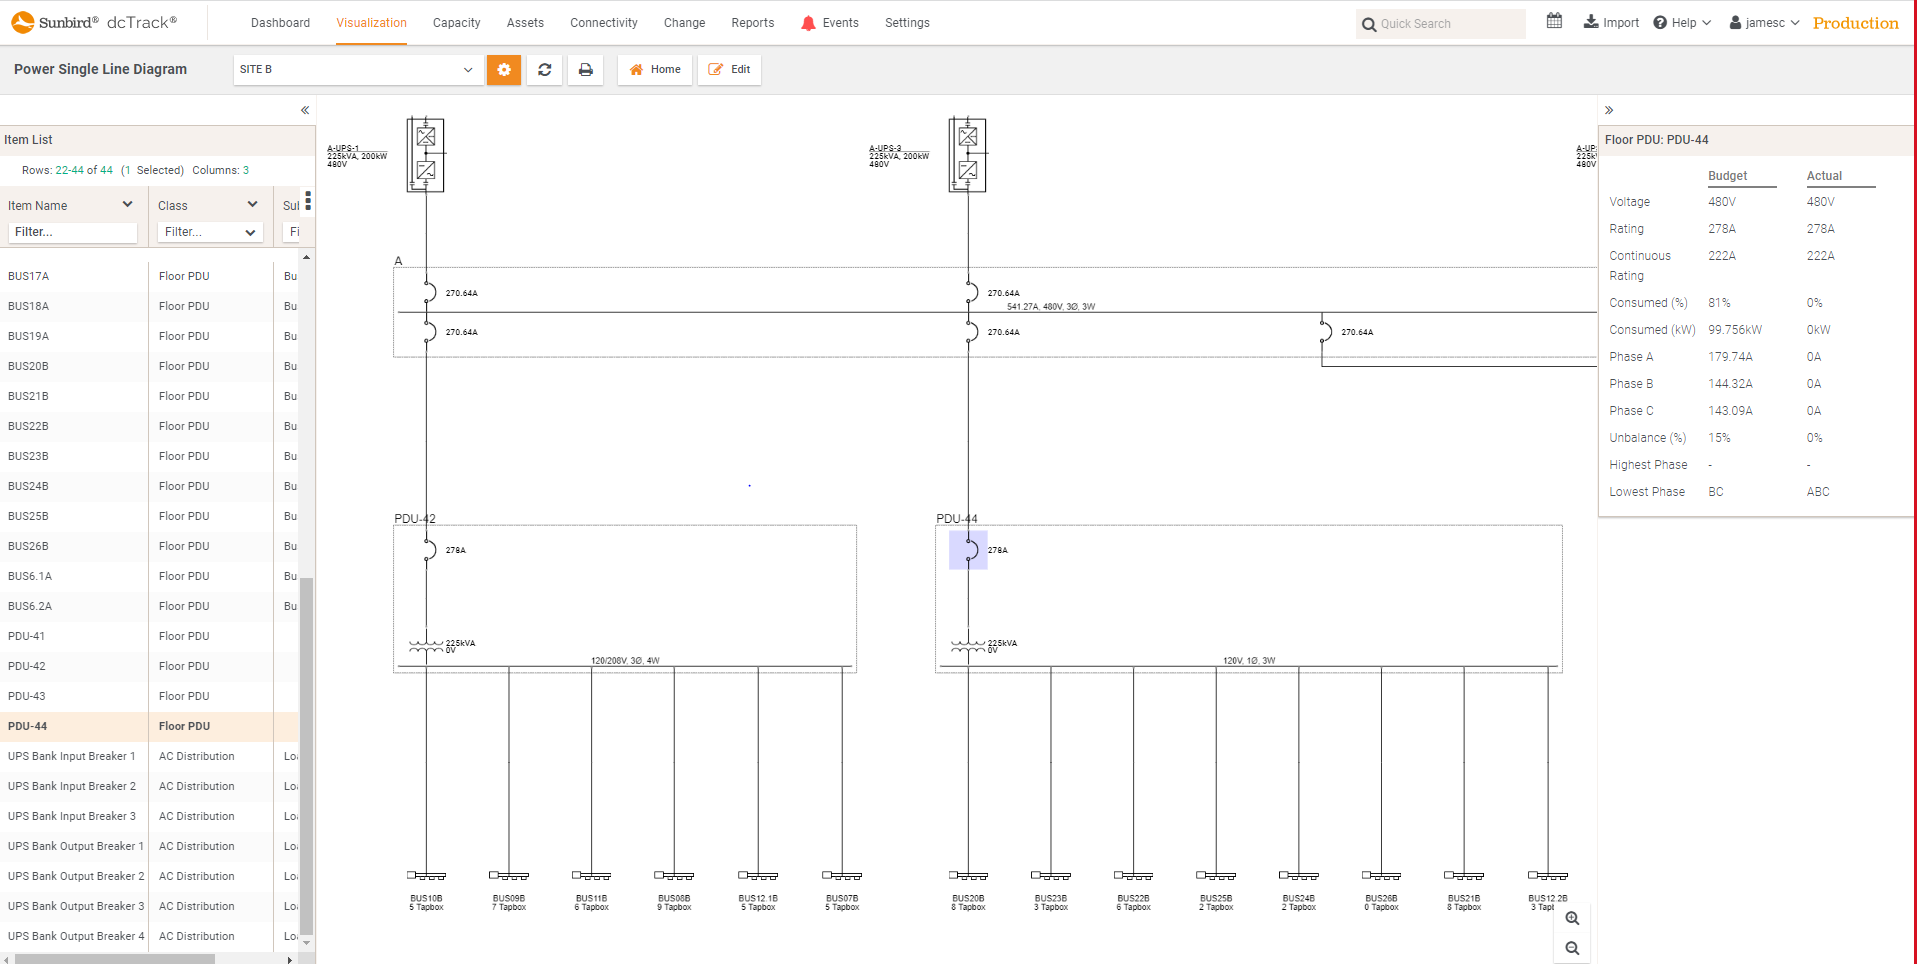
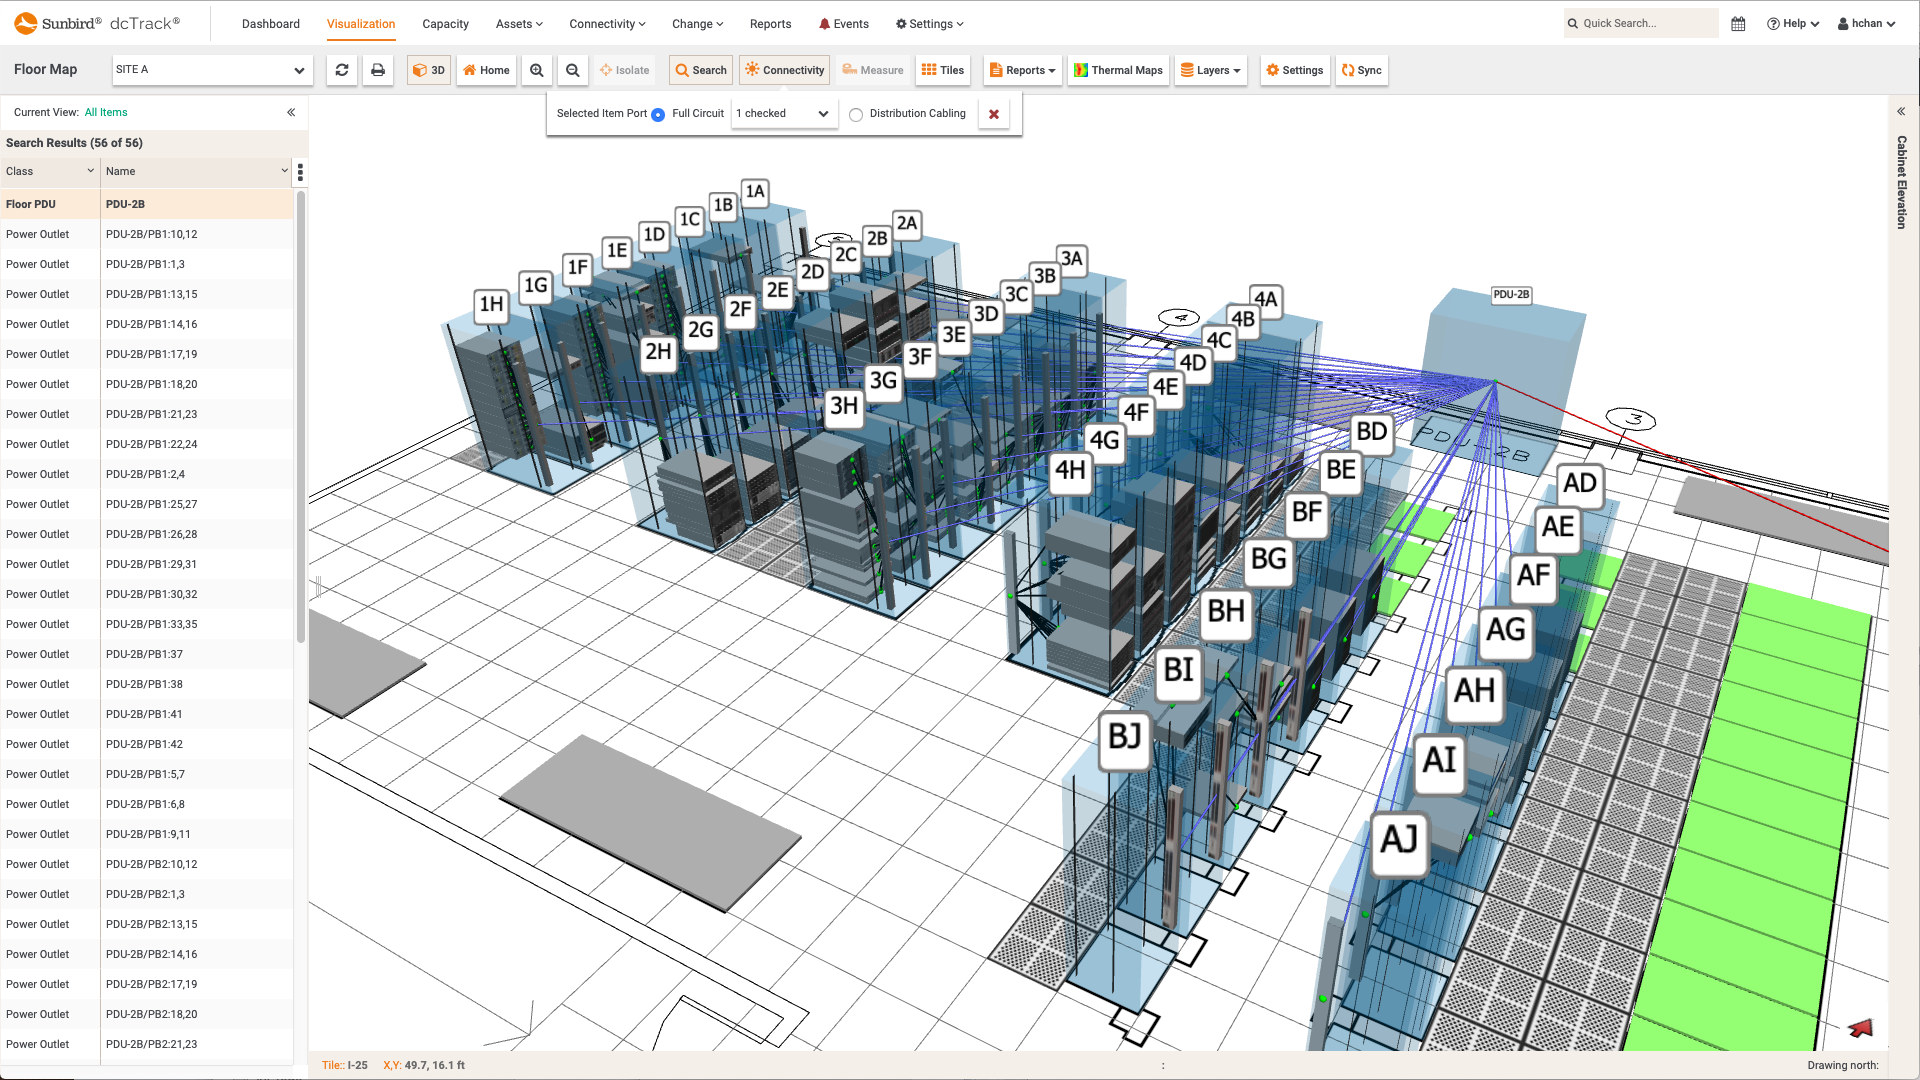
 dcTrack DCIM Operations | Visualization | Connectivity Management | Power ManagementSingle-Line Diagram
 -
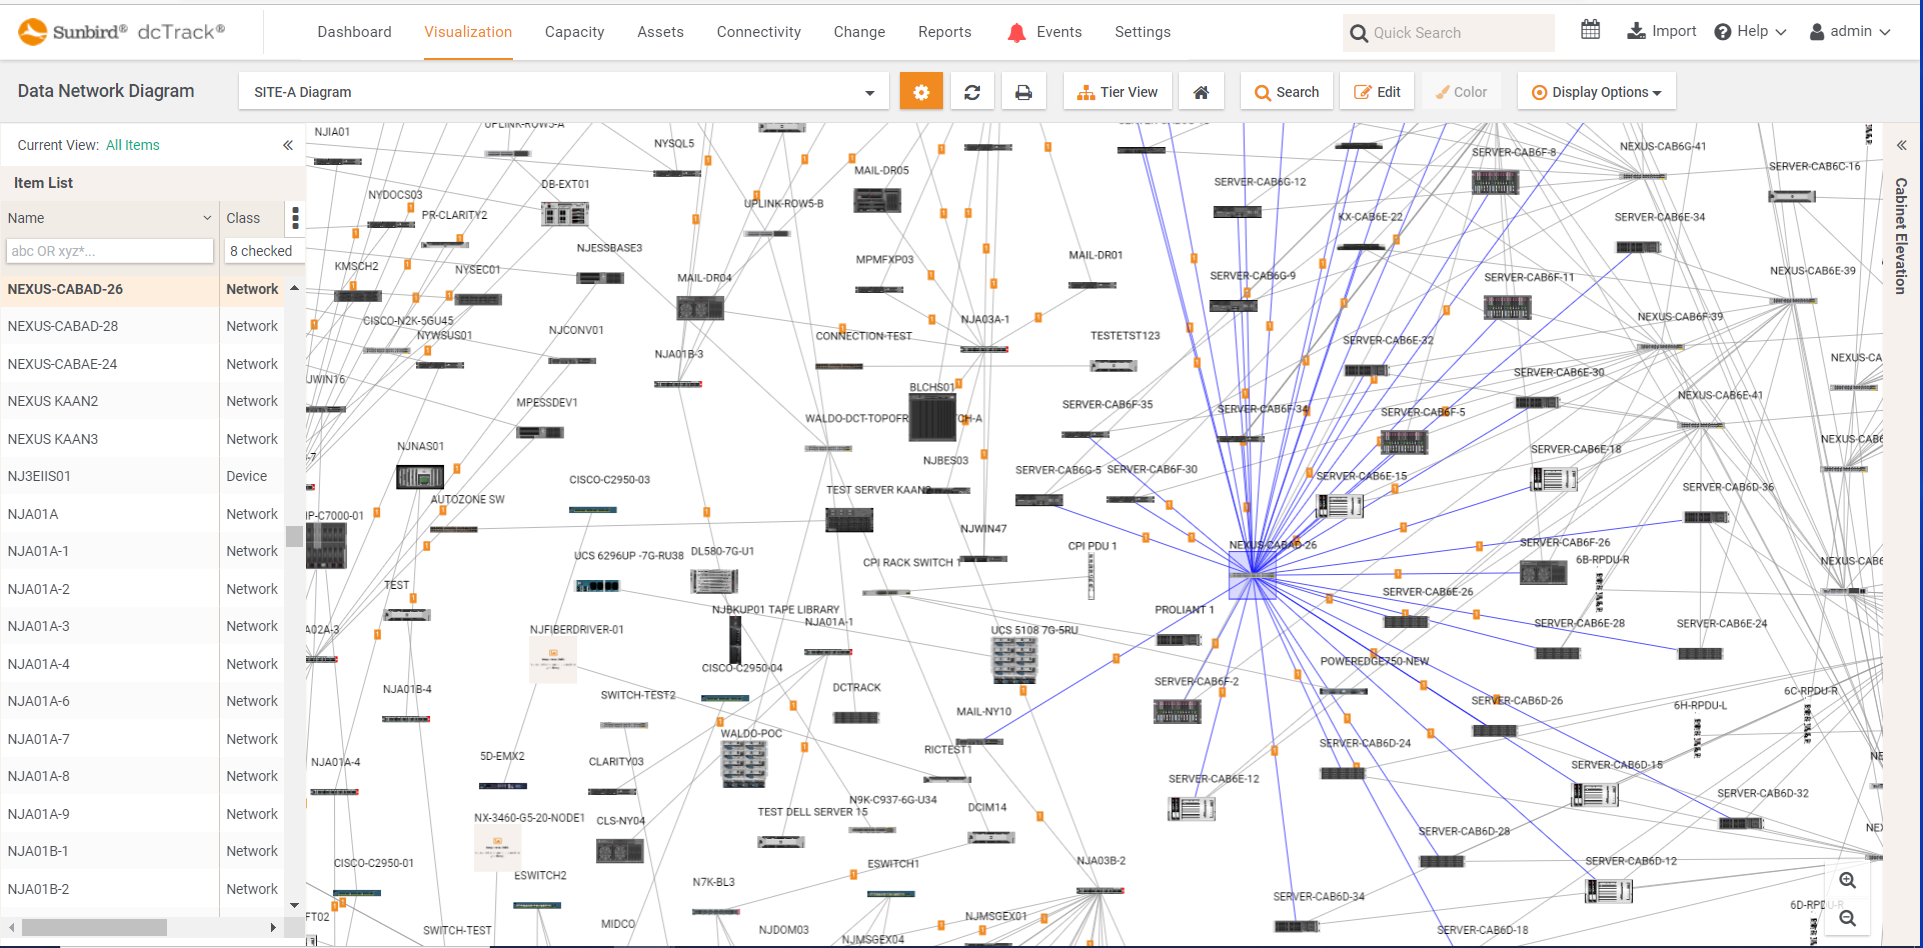
 dcTrack DCIM Operations | Connectivity Management | VisualizationNetwork Diagram with Model Images
 -
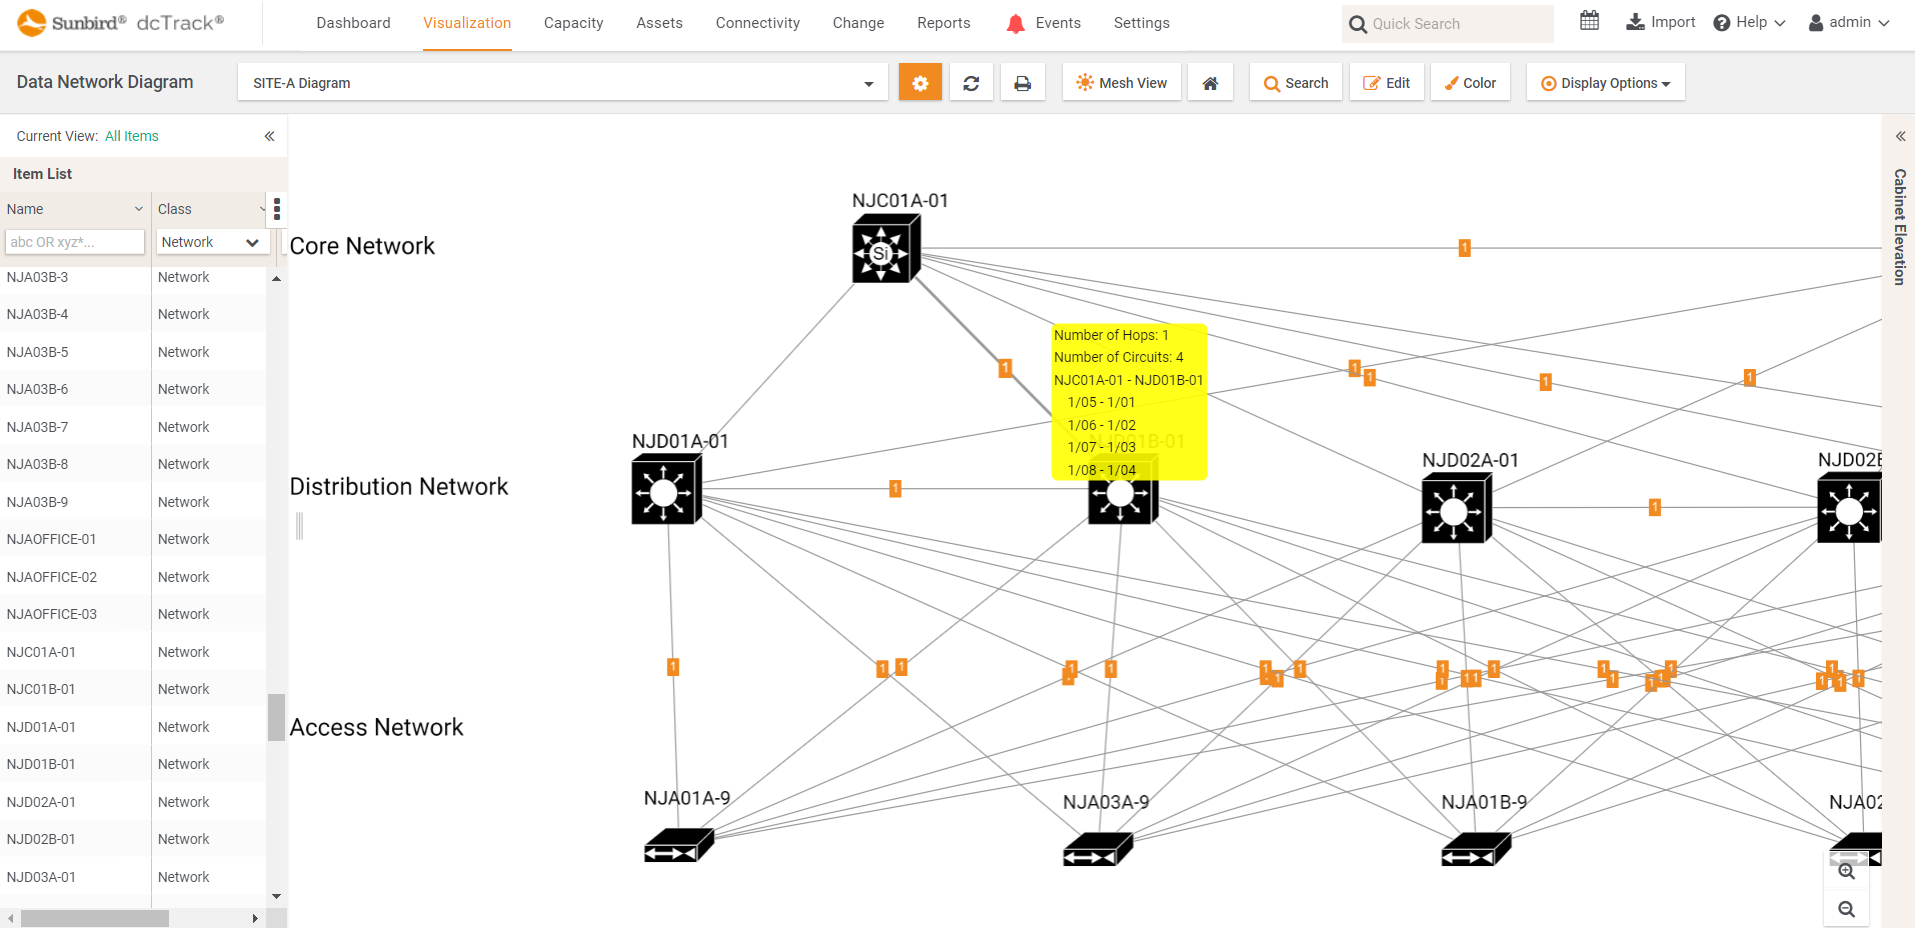
 dcTrack DCIM Operations | Connectivity Management | VisualizationNetwork Diagram Tiered View
 -
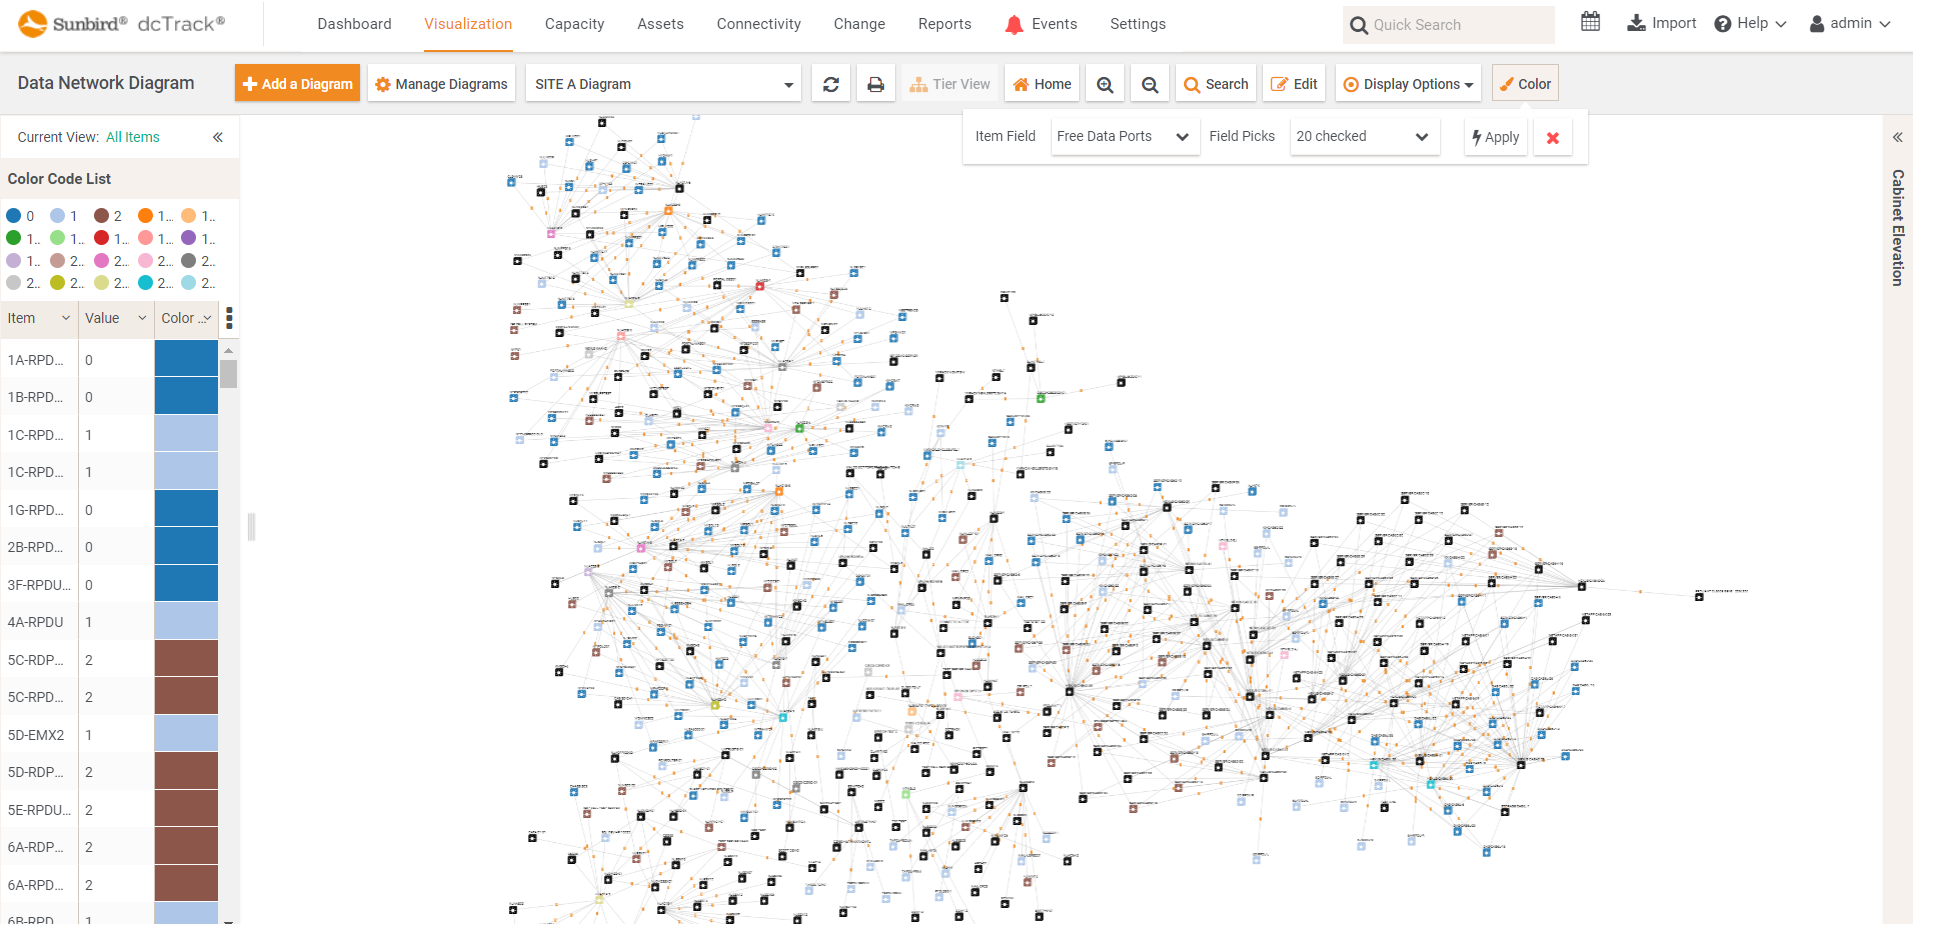
 dcTrack DCIM Operations | Connectivity Management | VisualizationNetwork Diagram Mesh View
 -
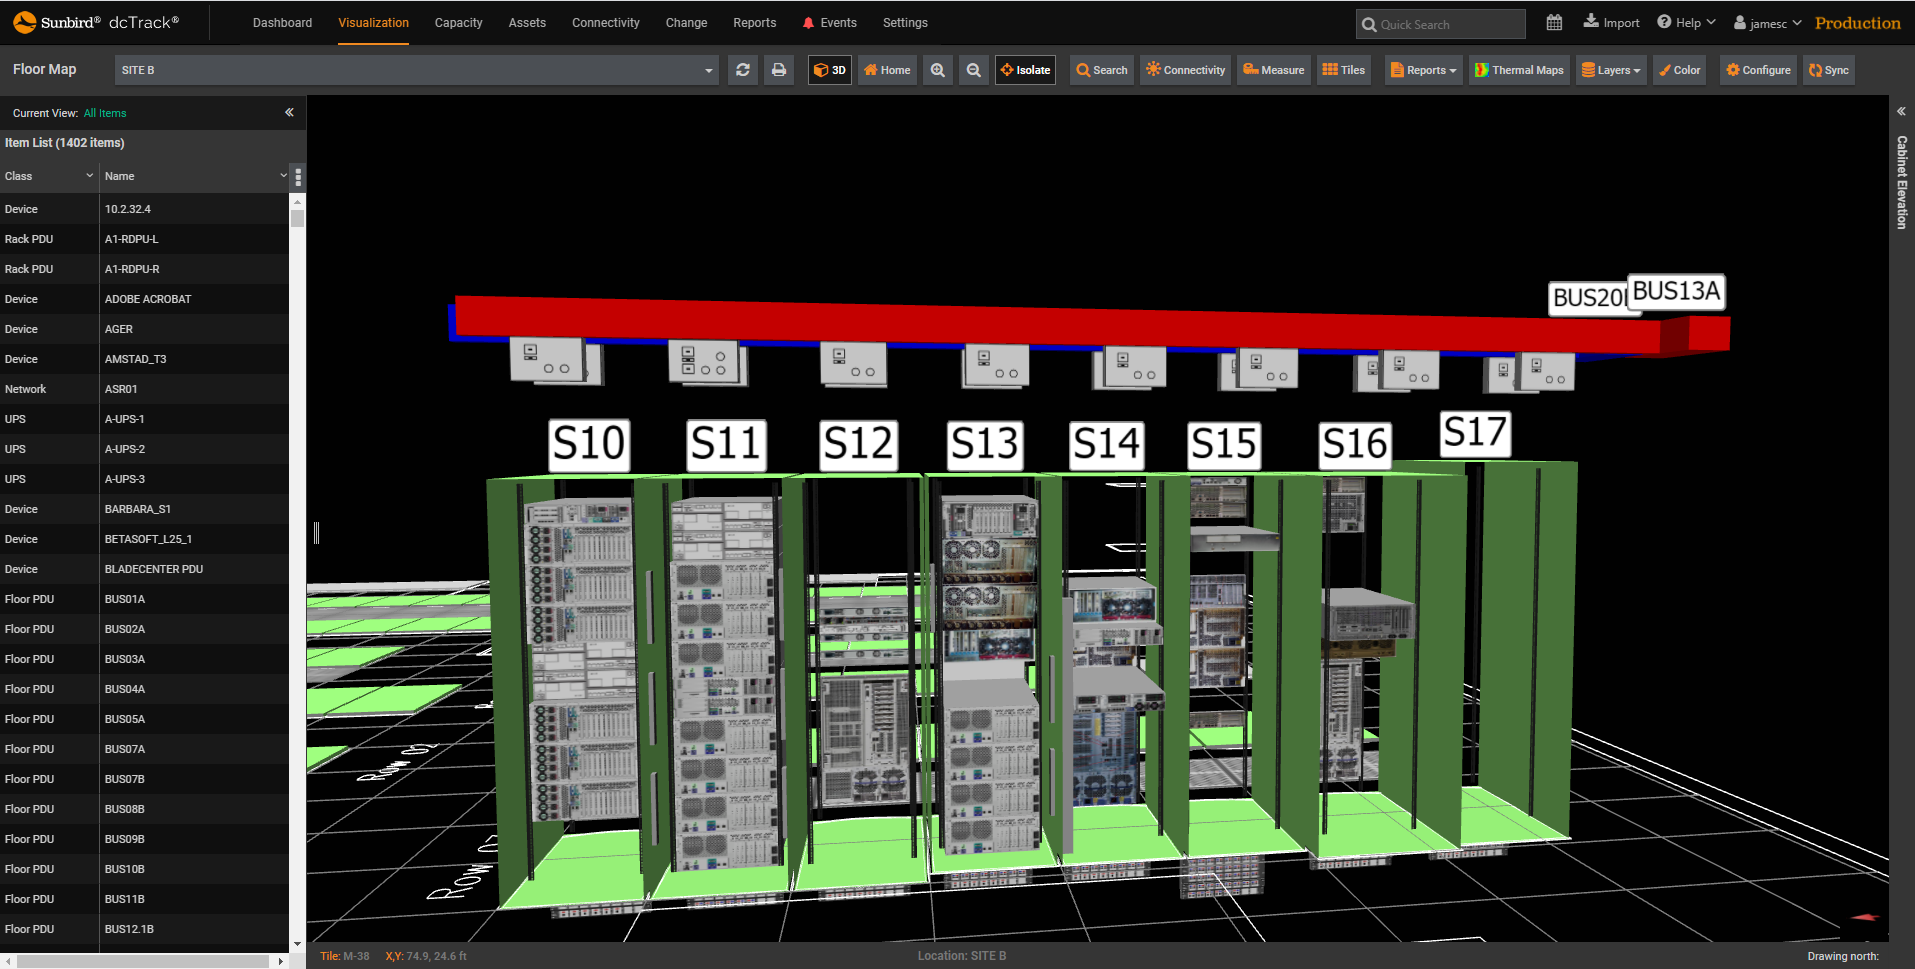
 dcTrack DCIM Operations | Visualization3D Visualization of Busway Infrastructure
 -
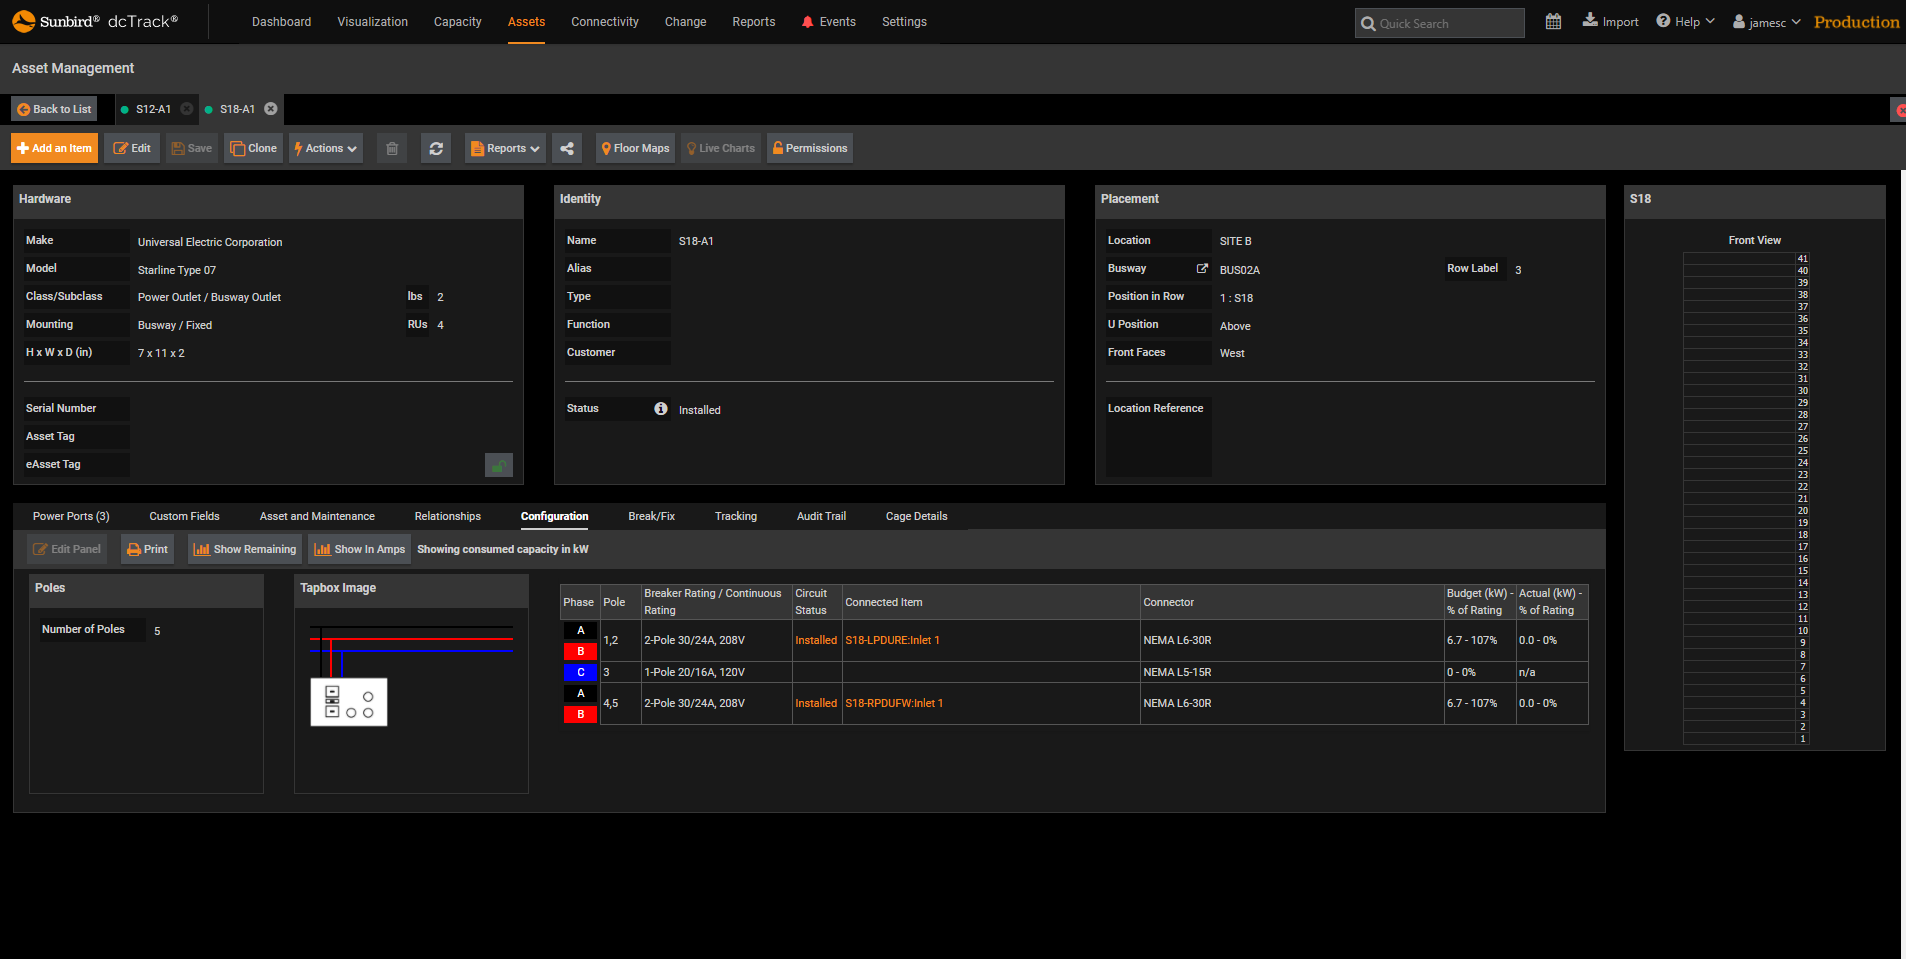
 dcTrack DCIM Operations | Asset Management | Capacity ManagementFull Details of Each Tap Box
 -
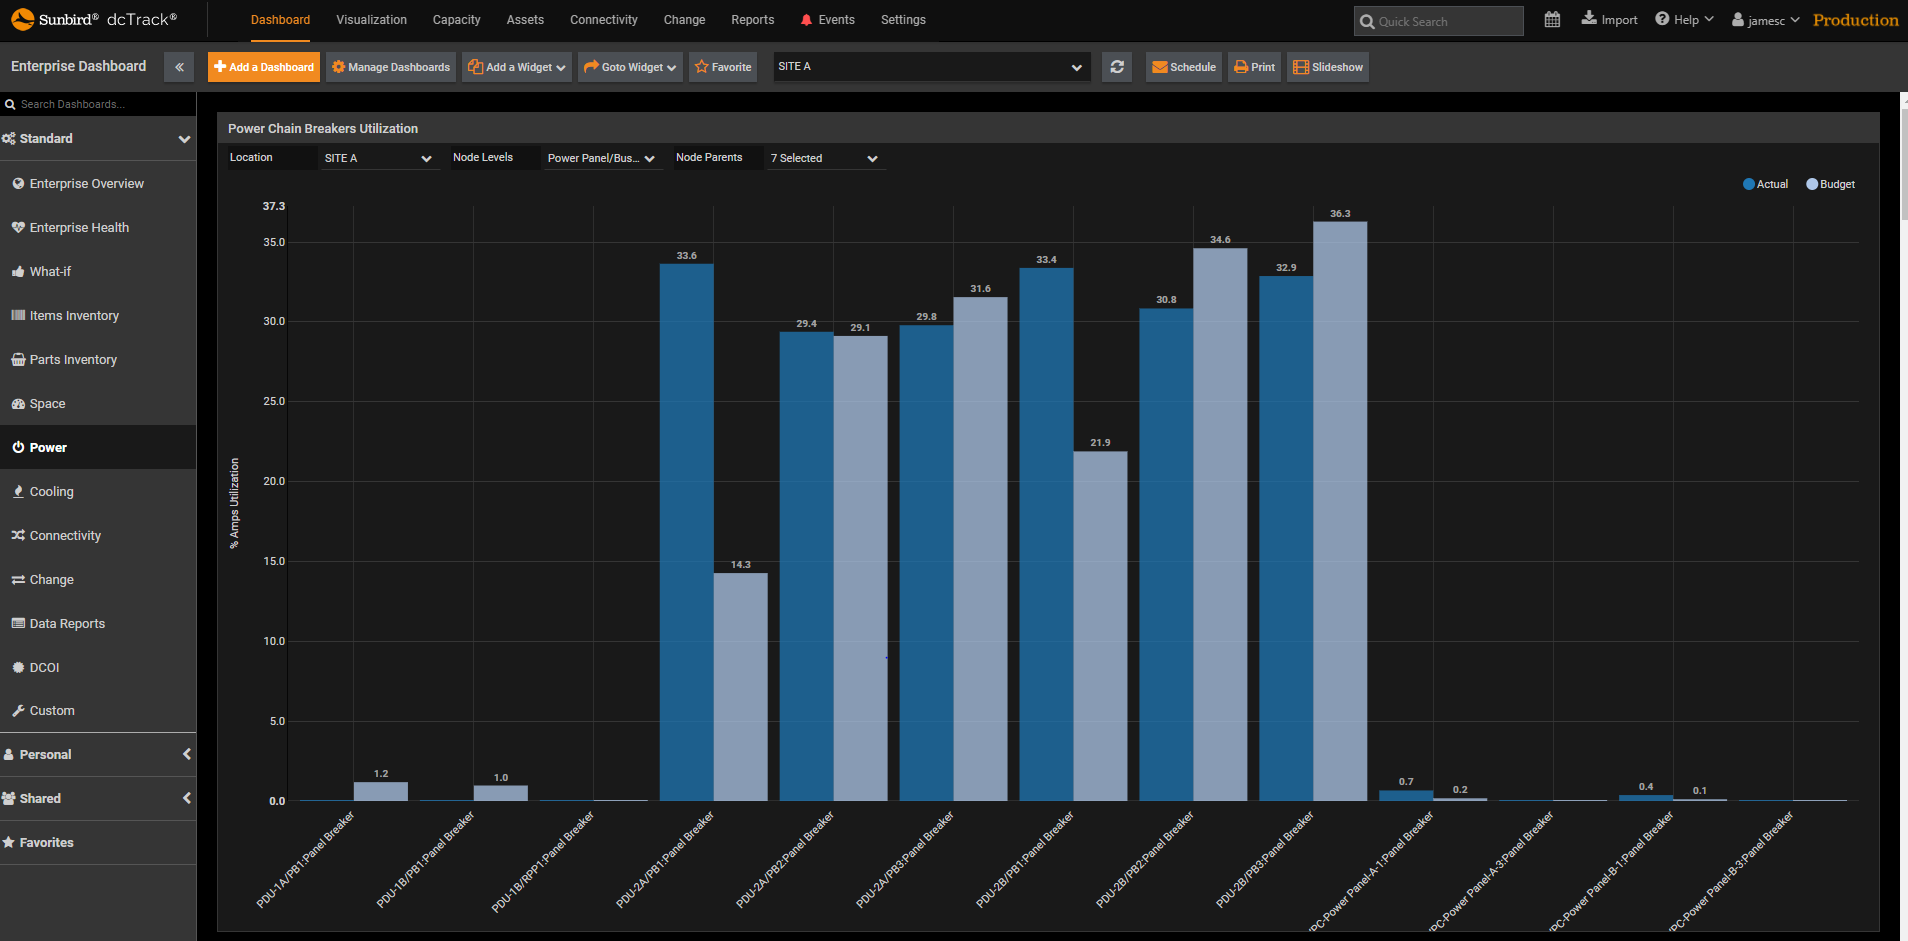
 dcTrack DCIM Operations | Capacity Management | DashboardsBusway Utilization Dashboard Chart
 -
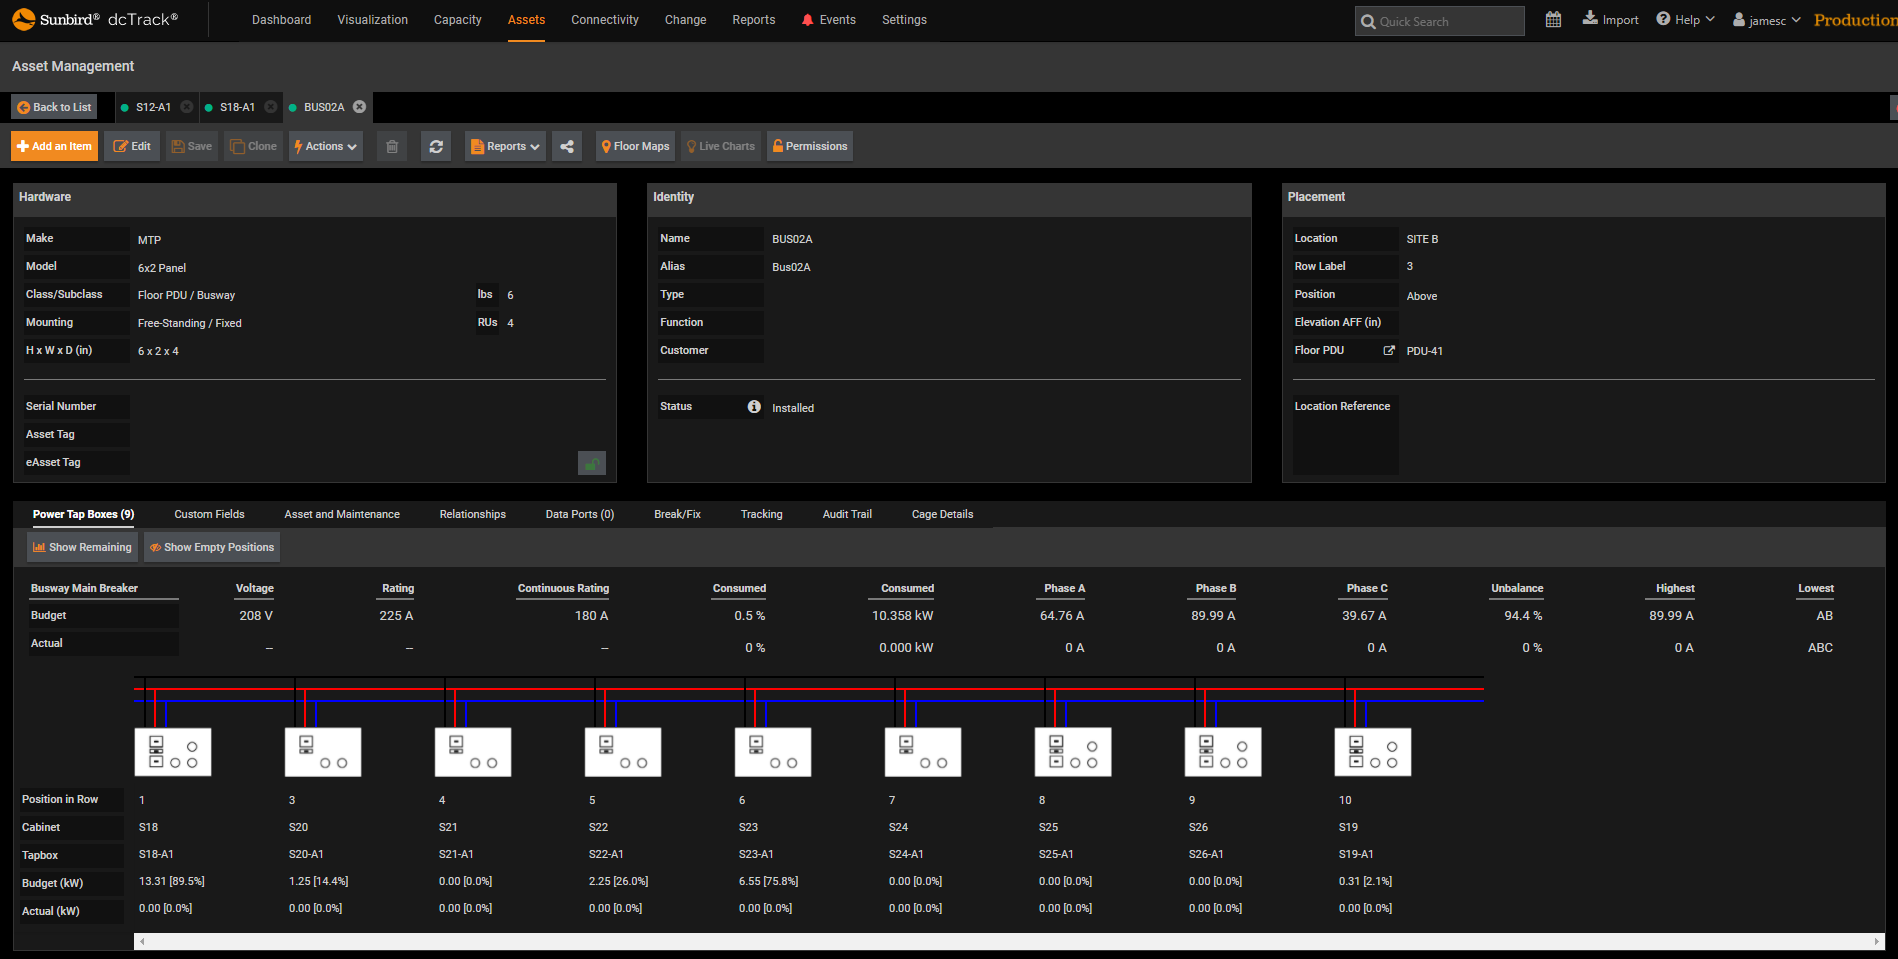
 dcTrack DCIM Operations | Asset Management | Capacity ManagementFull Details of Each Busway
 -
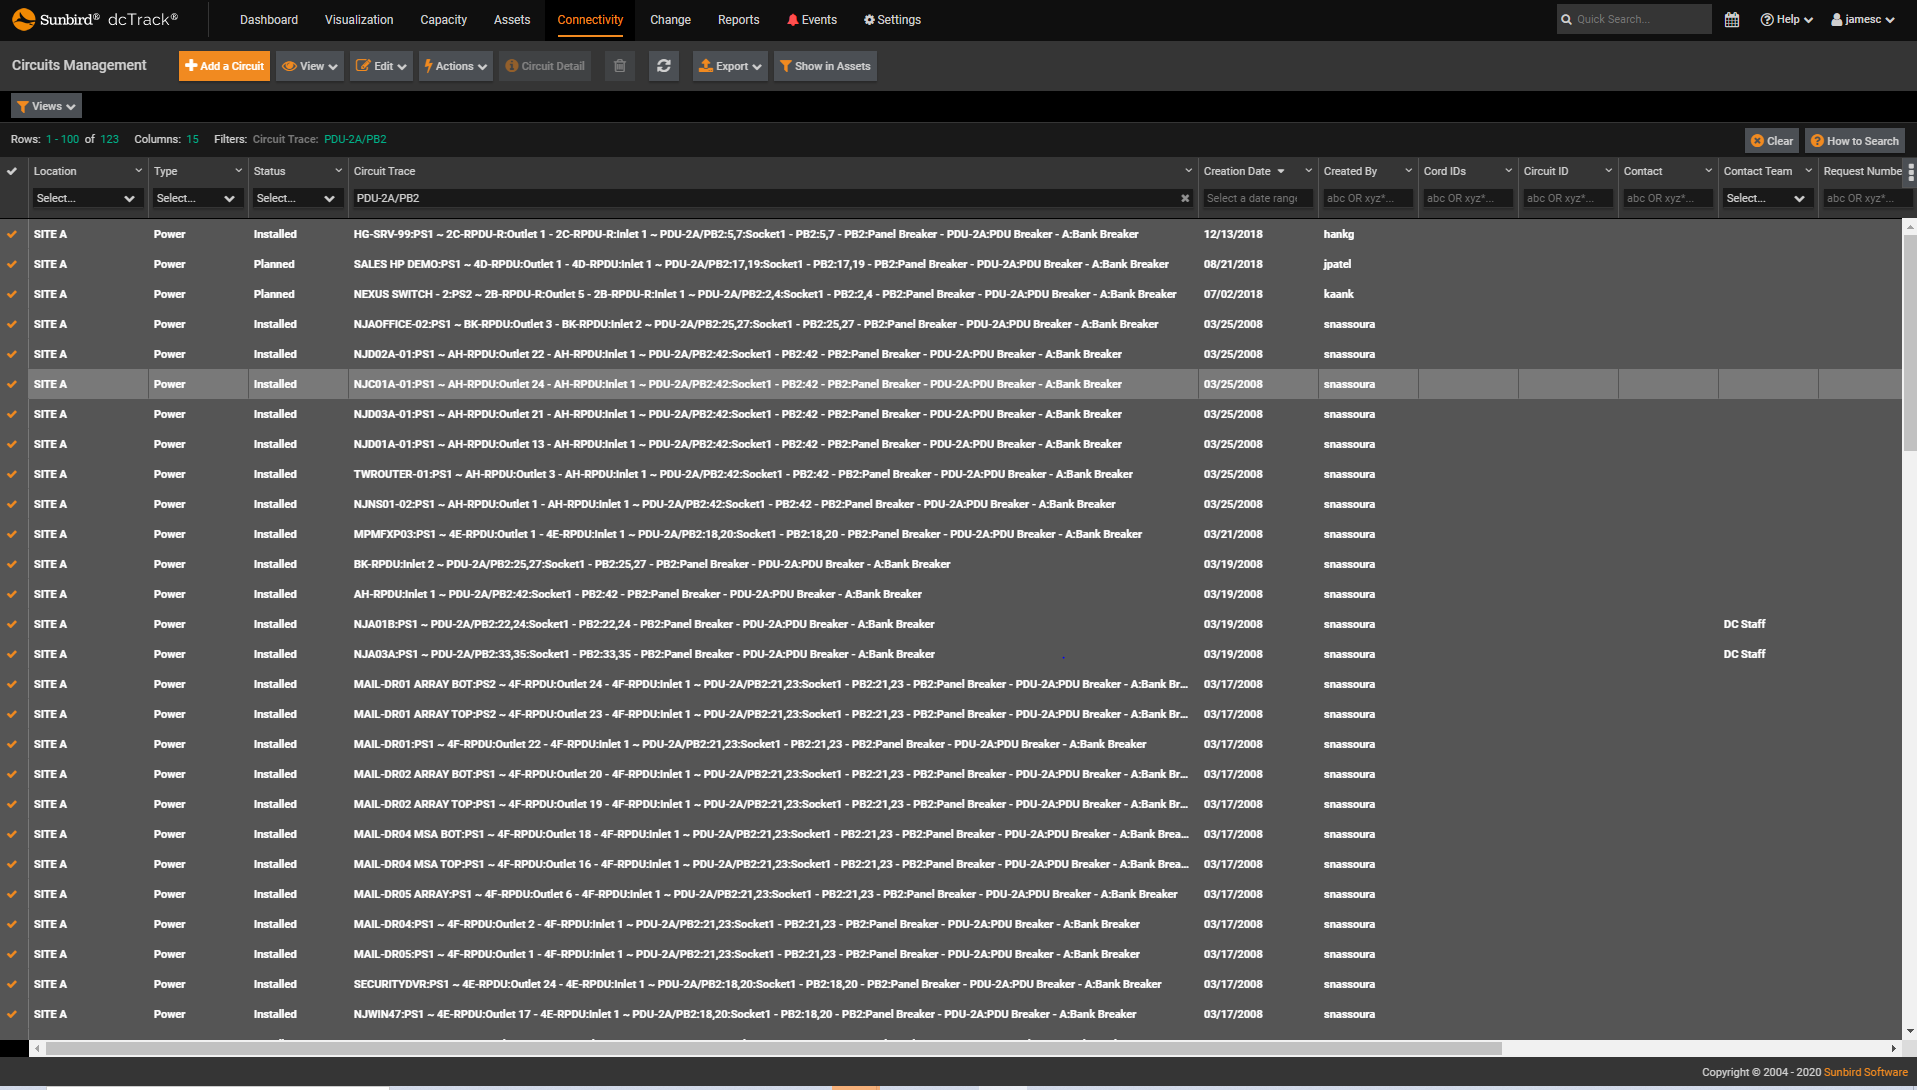
 dcTrack DCIM Operations | Connectivity ManagementImpact Analysis From Any Point in a Data or Power Circuit
 -
 dcTrack DCIM Operations | Connectivity ManagementDirect Current Power Chain Utilization
 -
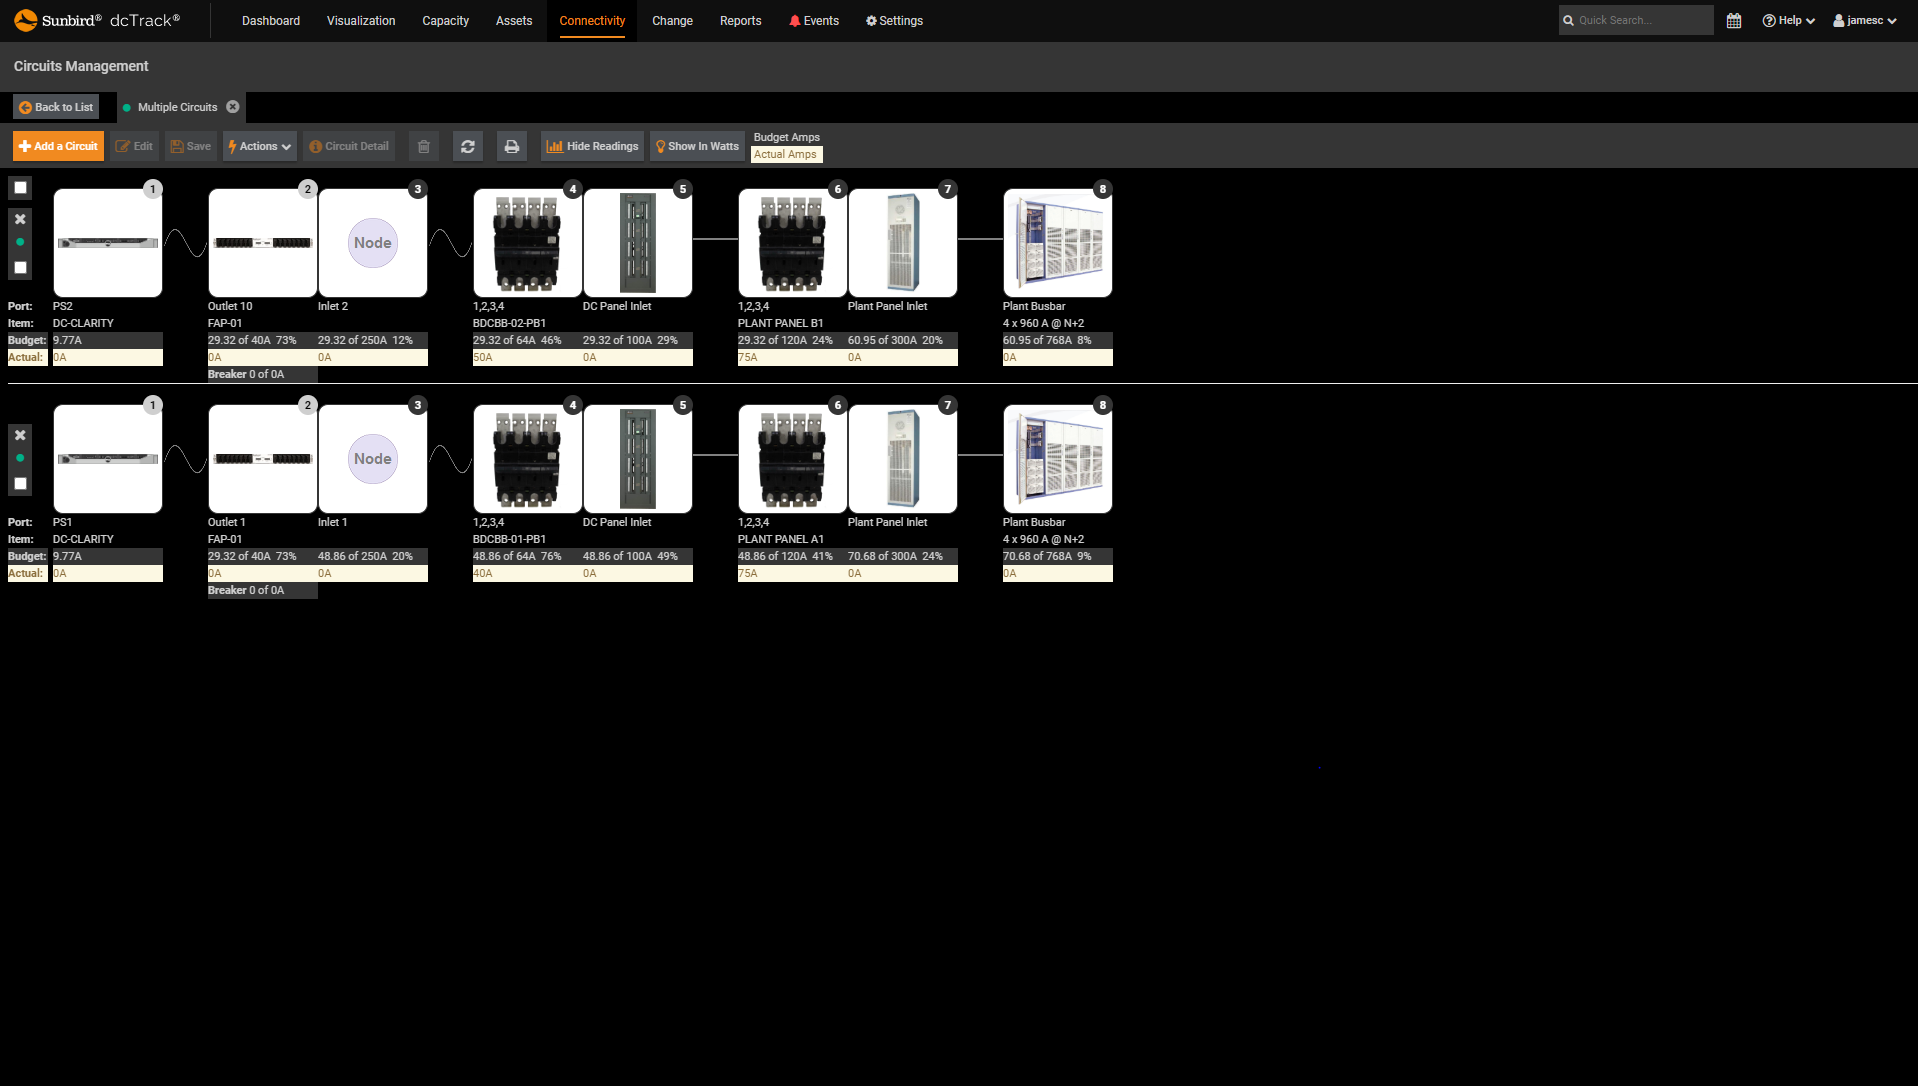
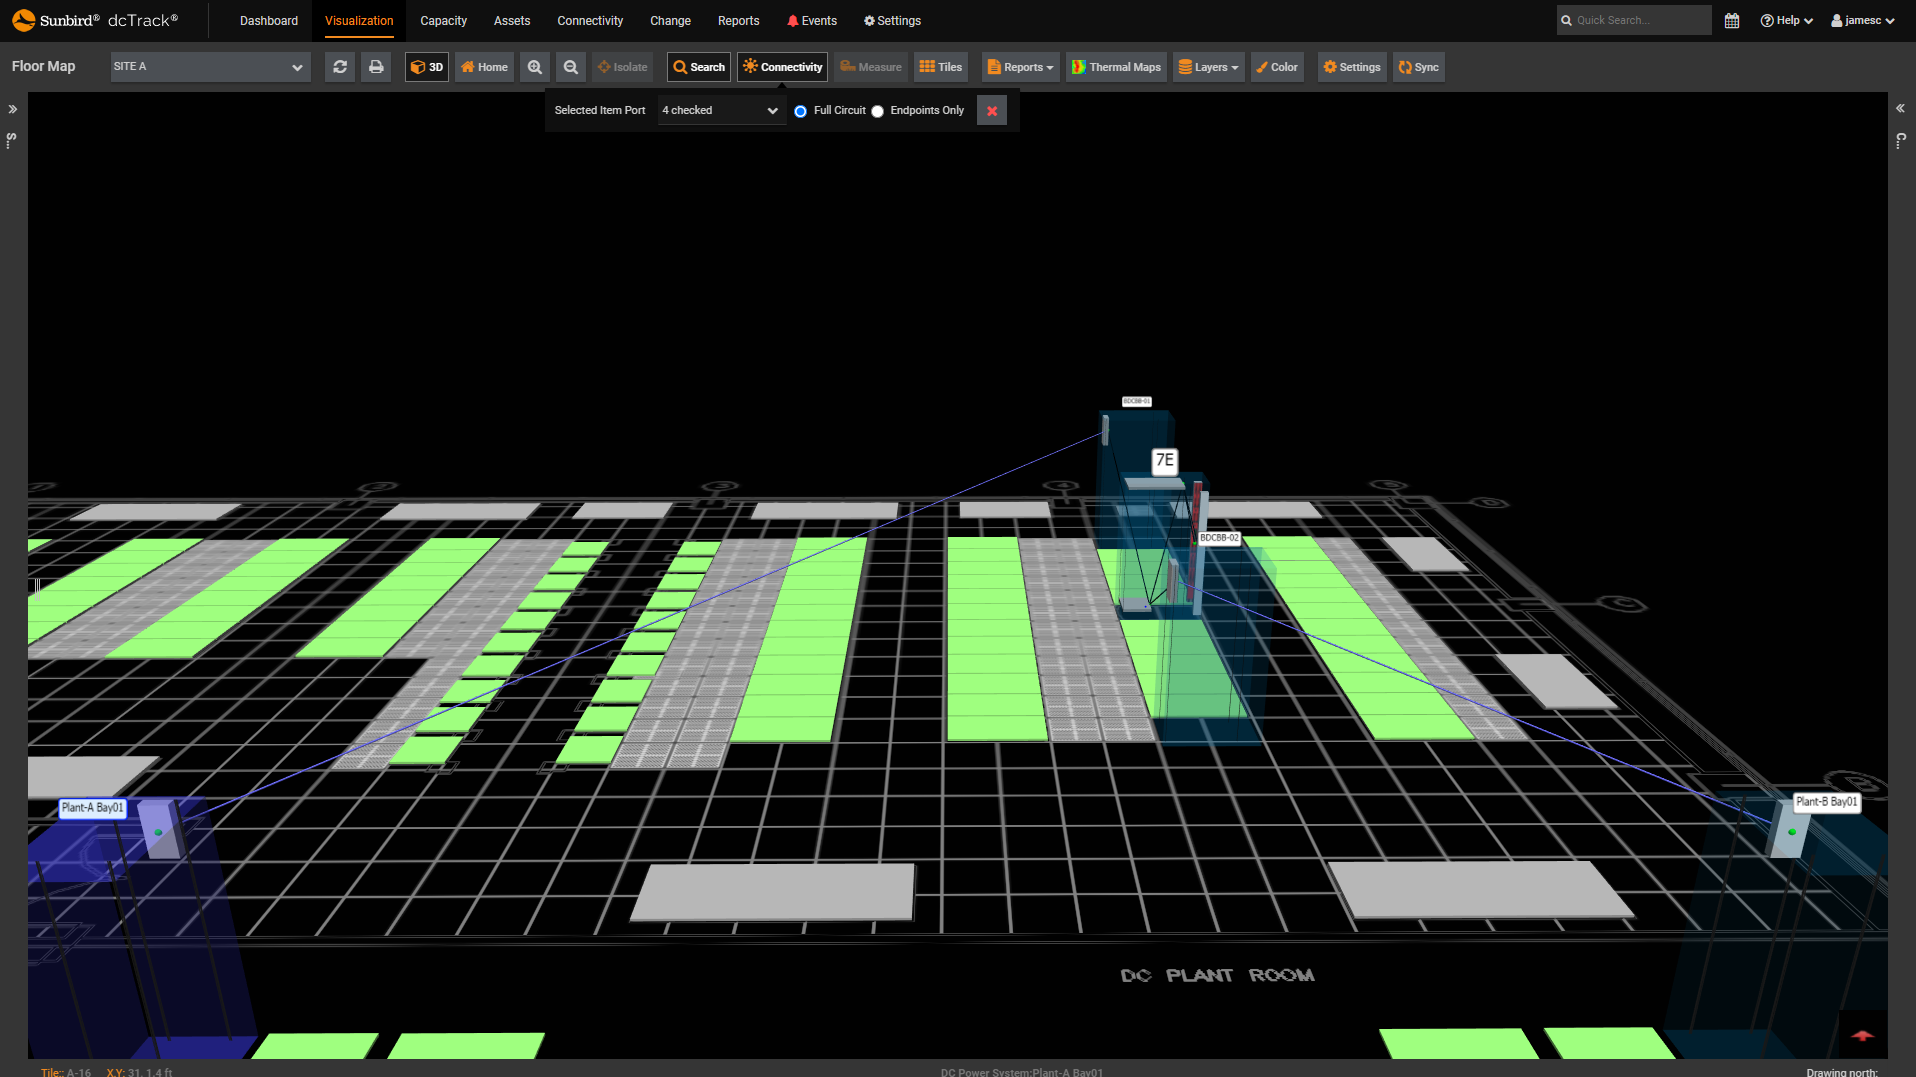
 dcTrack DCIM Operations | Connectivity ManagementEnd to End DC Power Chain
 -
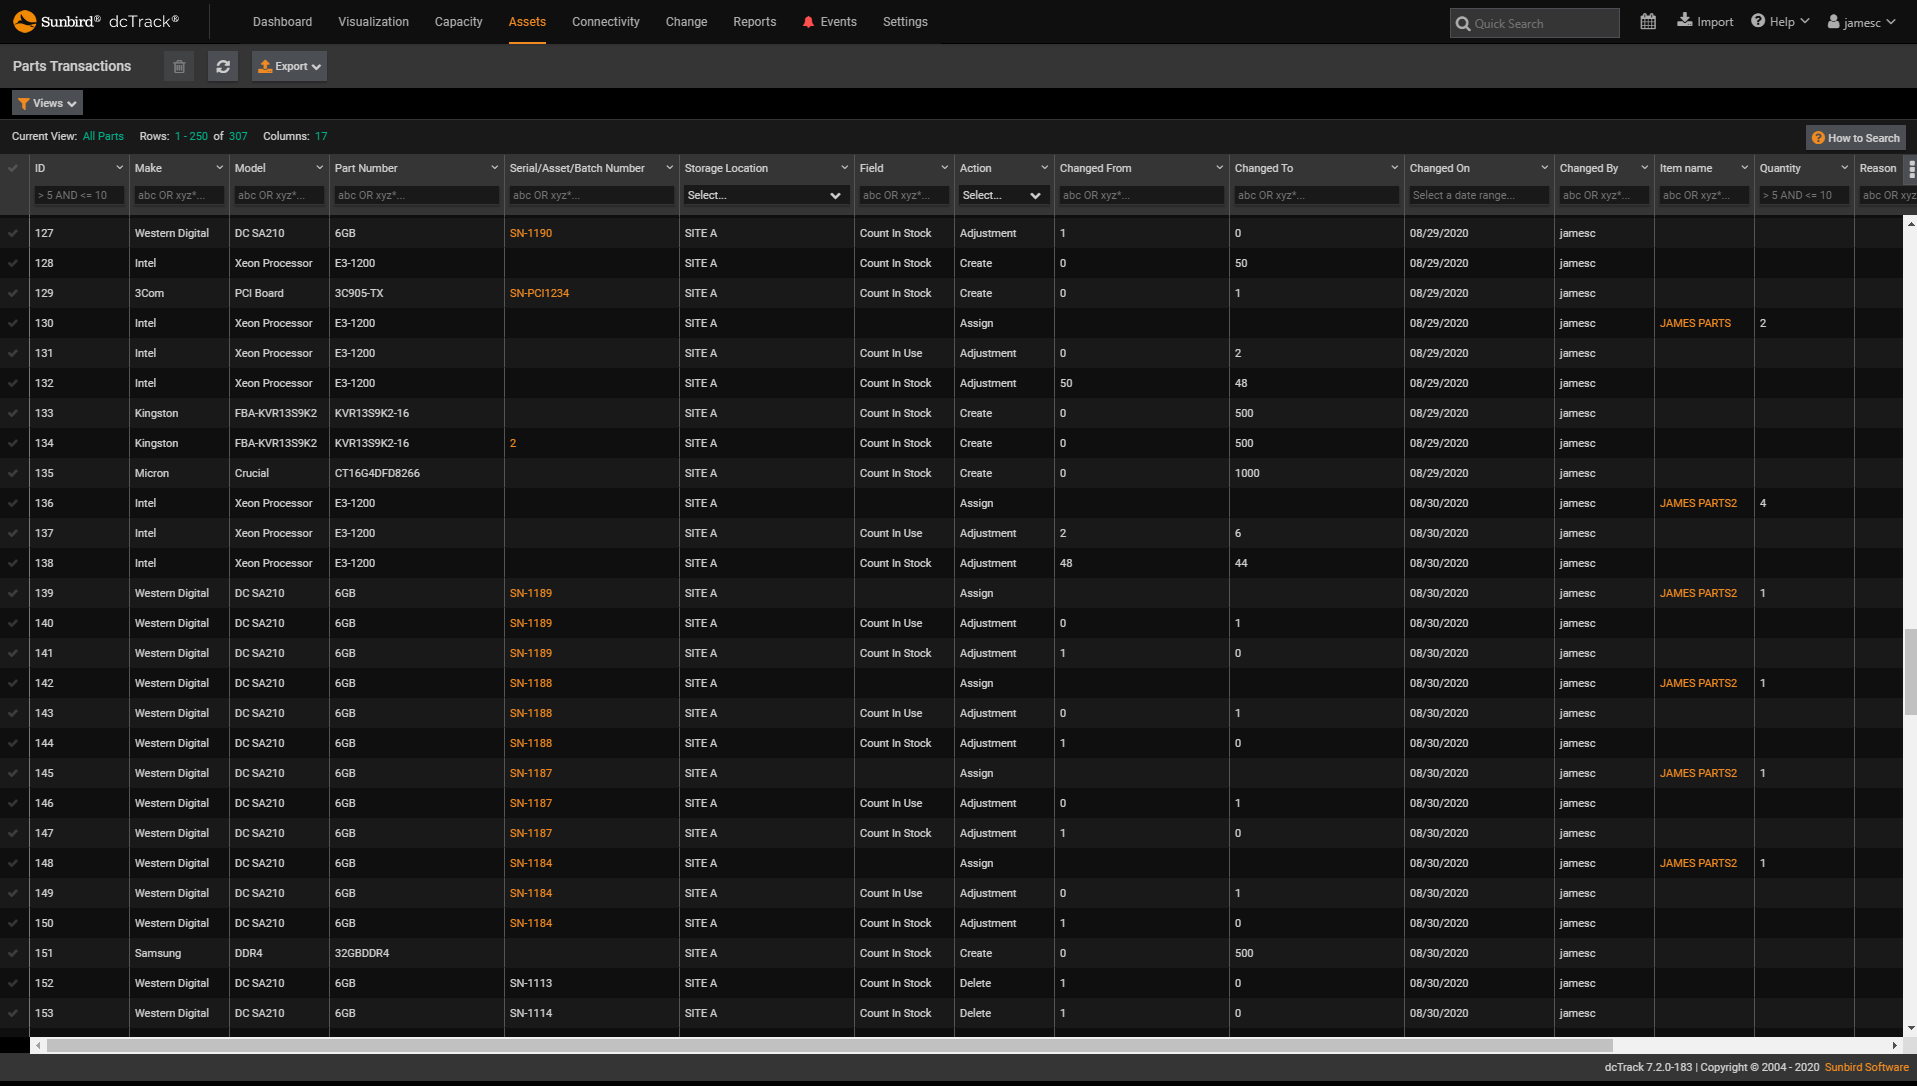
 dcTrack DCIM Operations | Asset ManagementParts Transactions
 -
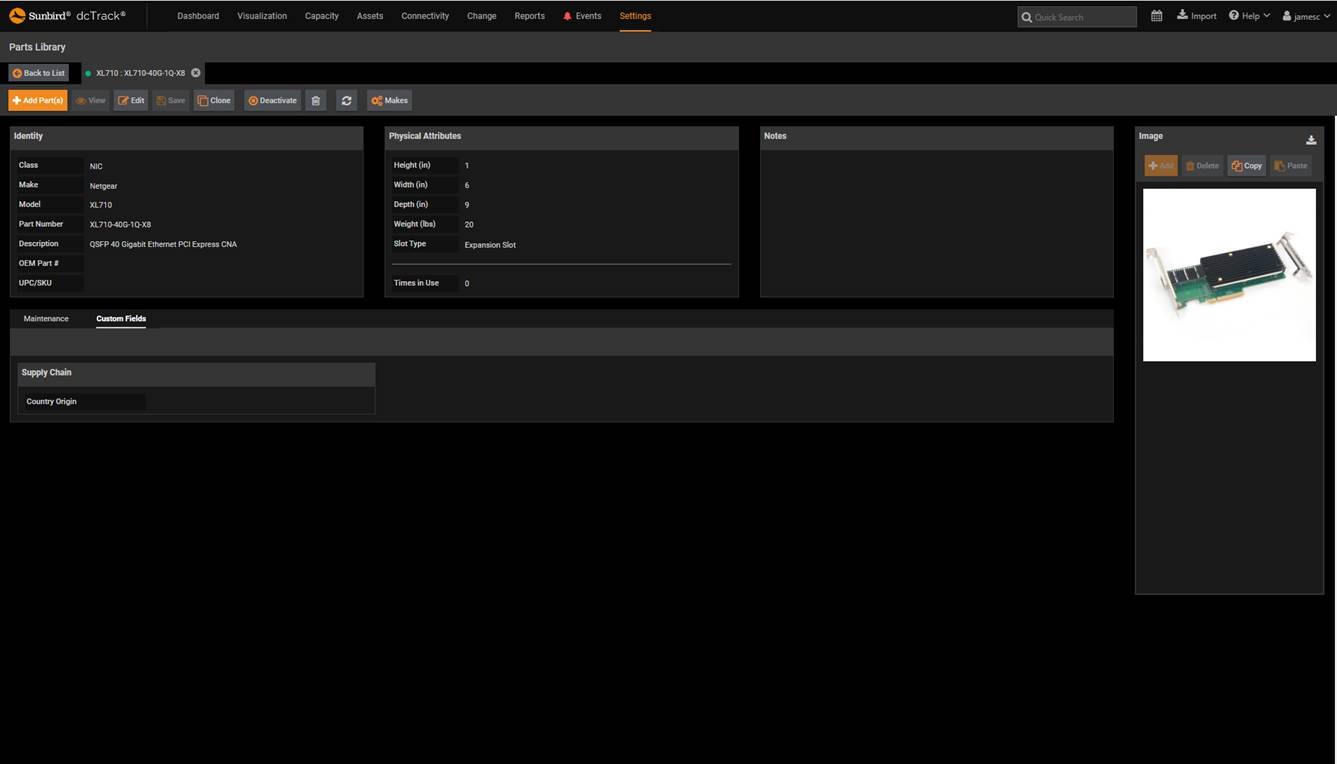
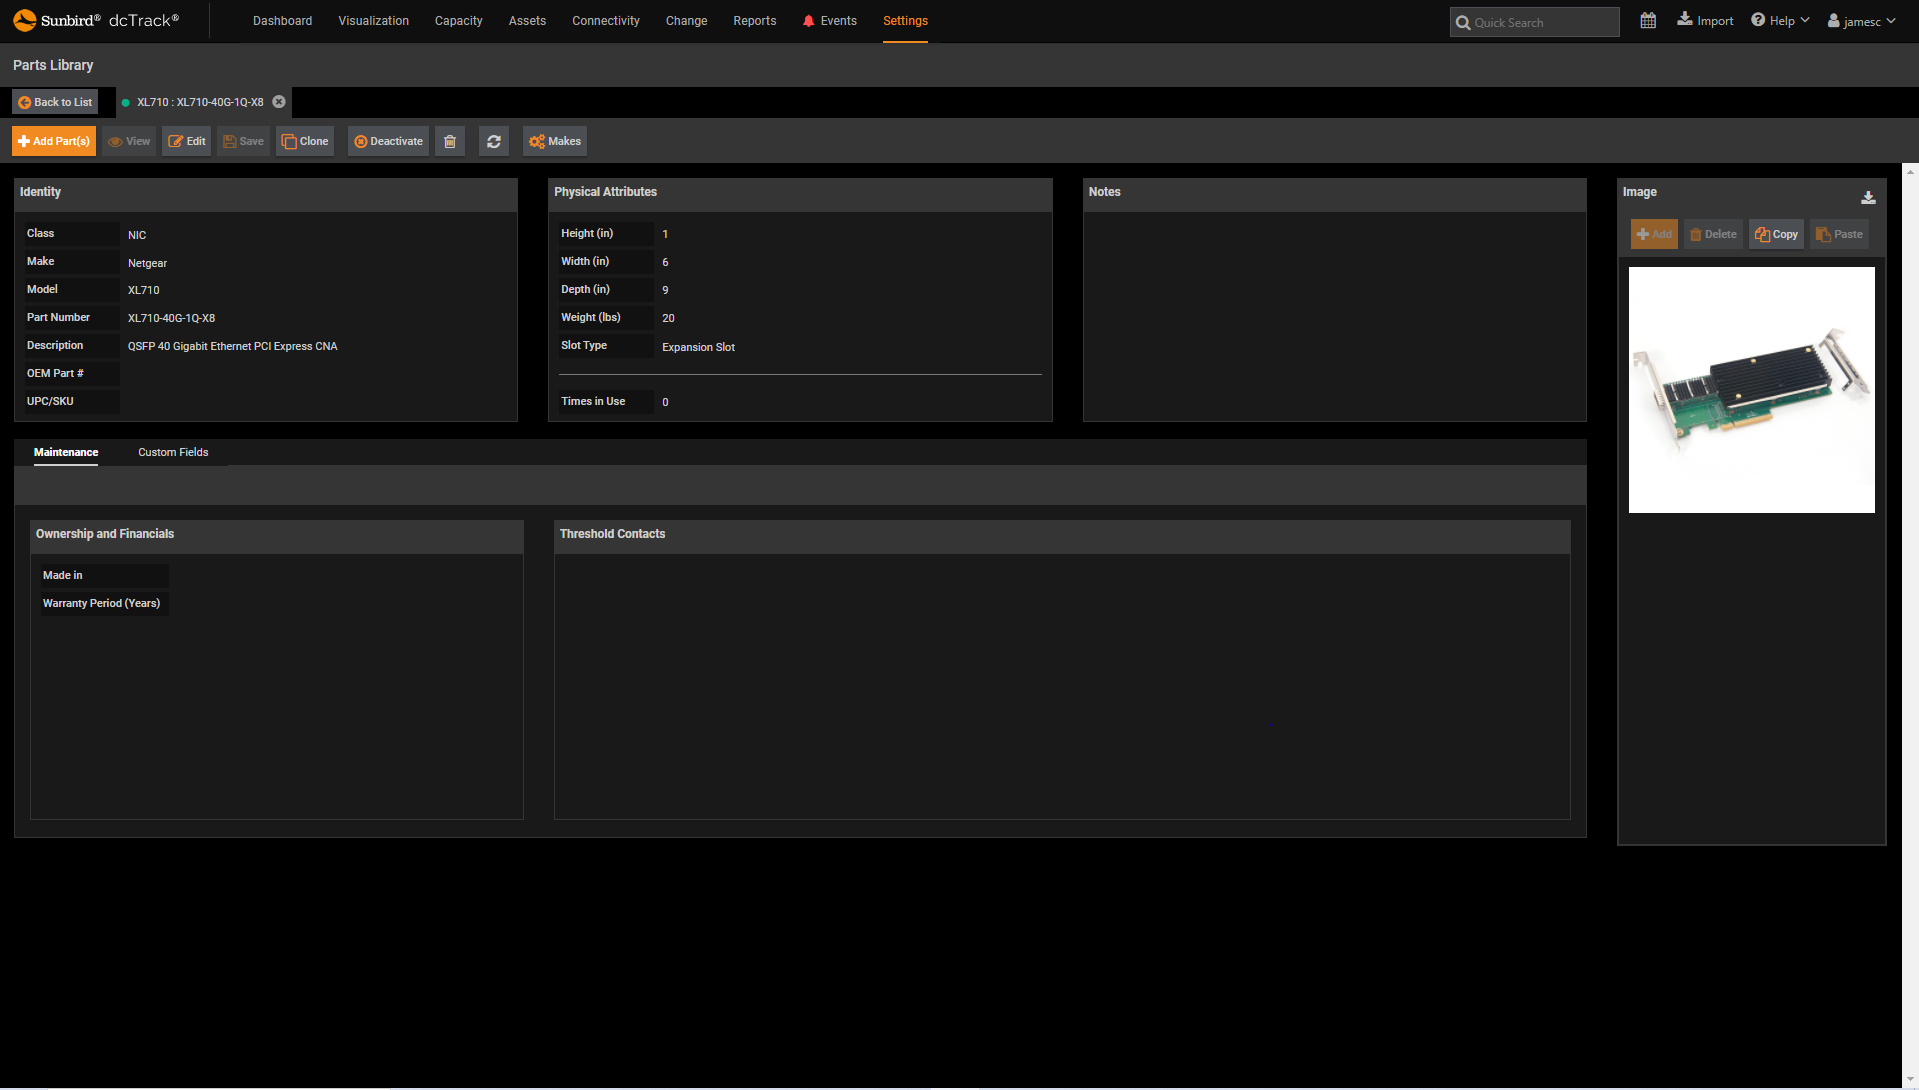
 dcTrack DCIM Operations | Asset ManagementParts Custom Fields
 -
 dcTrack DCIM Operations | Asset ManagementSpare Parts
 -
 dcTrack DCIM Operations | Asset ManagementParts Templates
 -
dcTrack DCIM Operations | Connectivity ManagementEnd to End DC Power Chain
-
dcTrack DCIM Operations | Connectivity ManagementDirect Current Power Chain Utilization
-
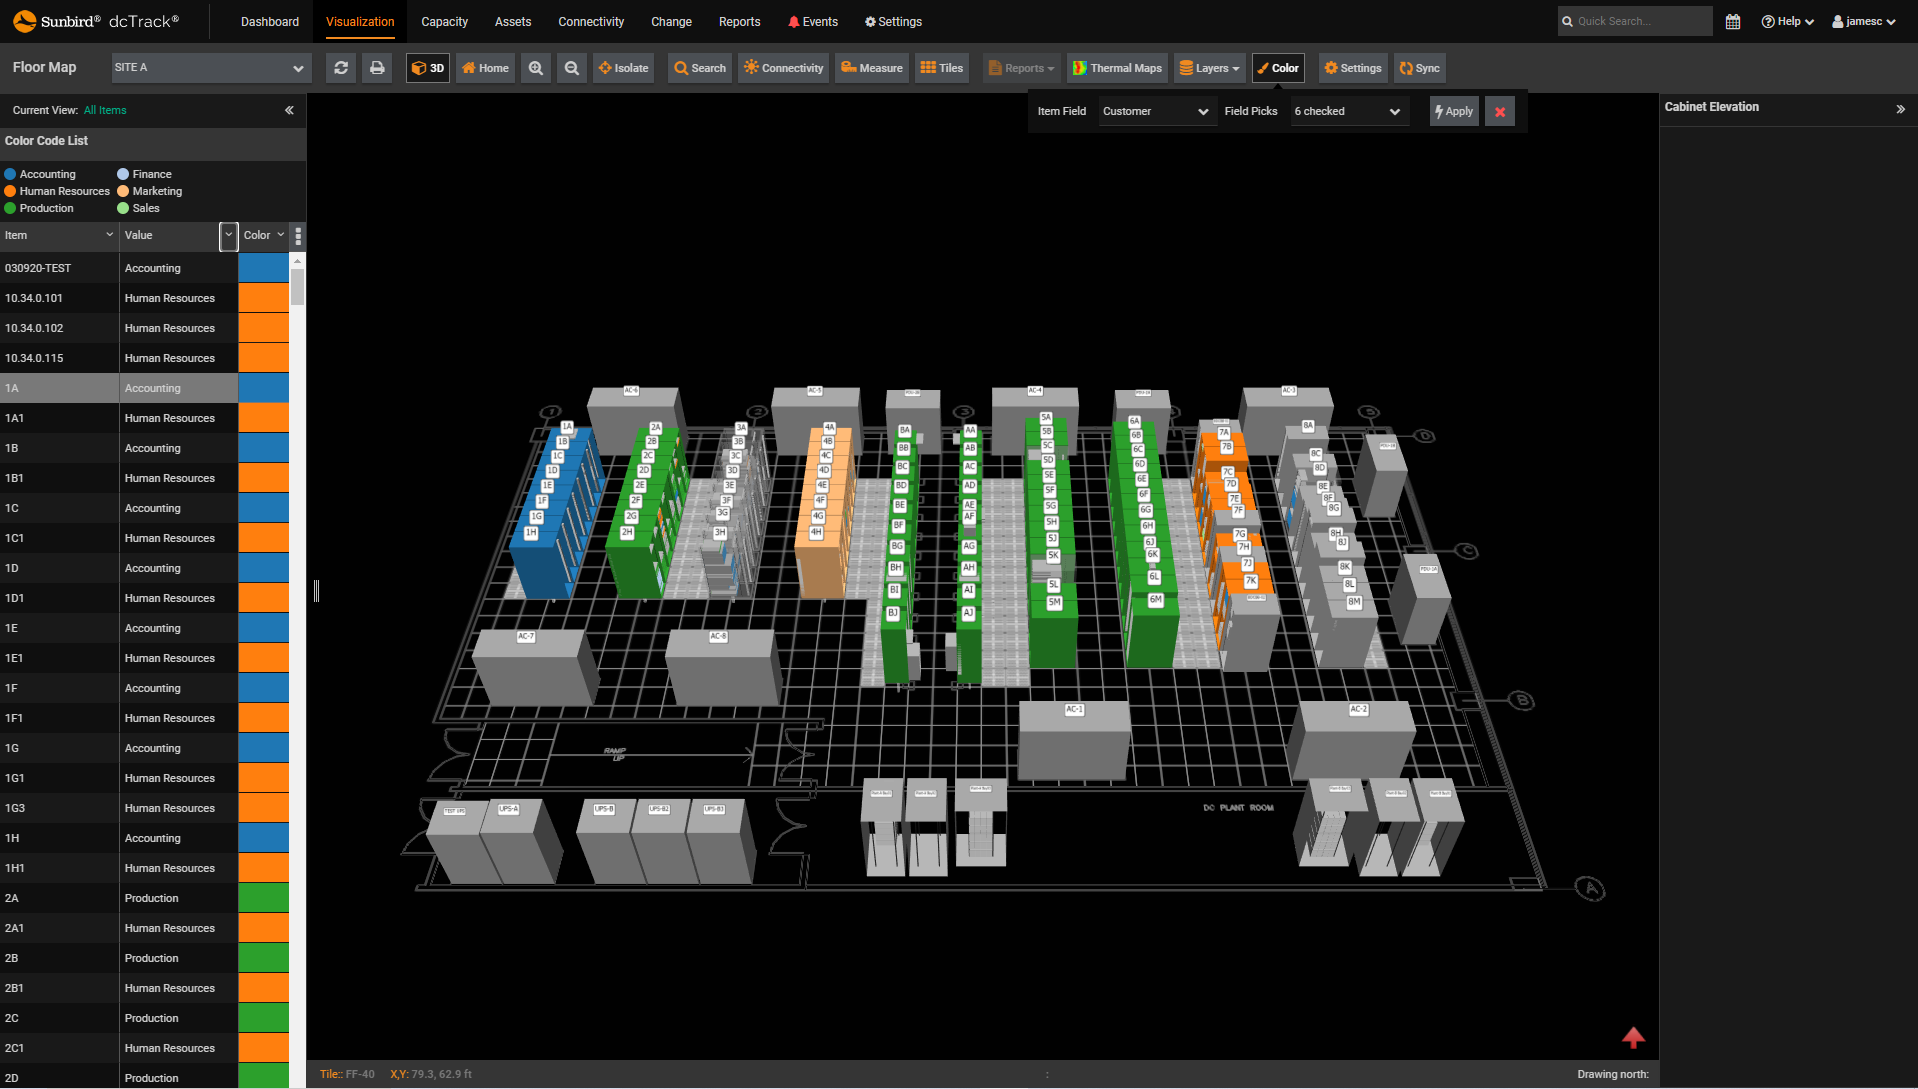
 dcTrack DCIM Operations | Asset ManagementSee Any Item Field in Color at the Rack and Item Level
 -
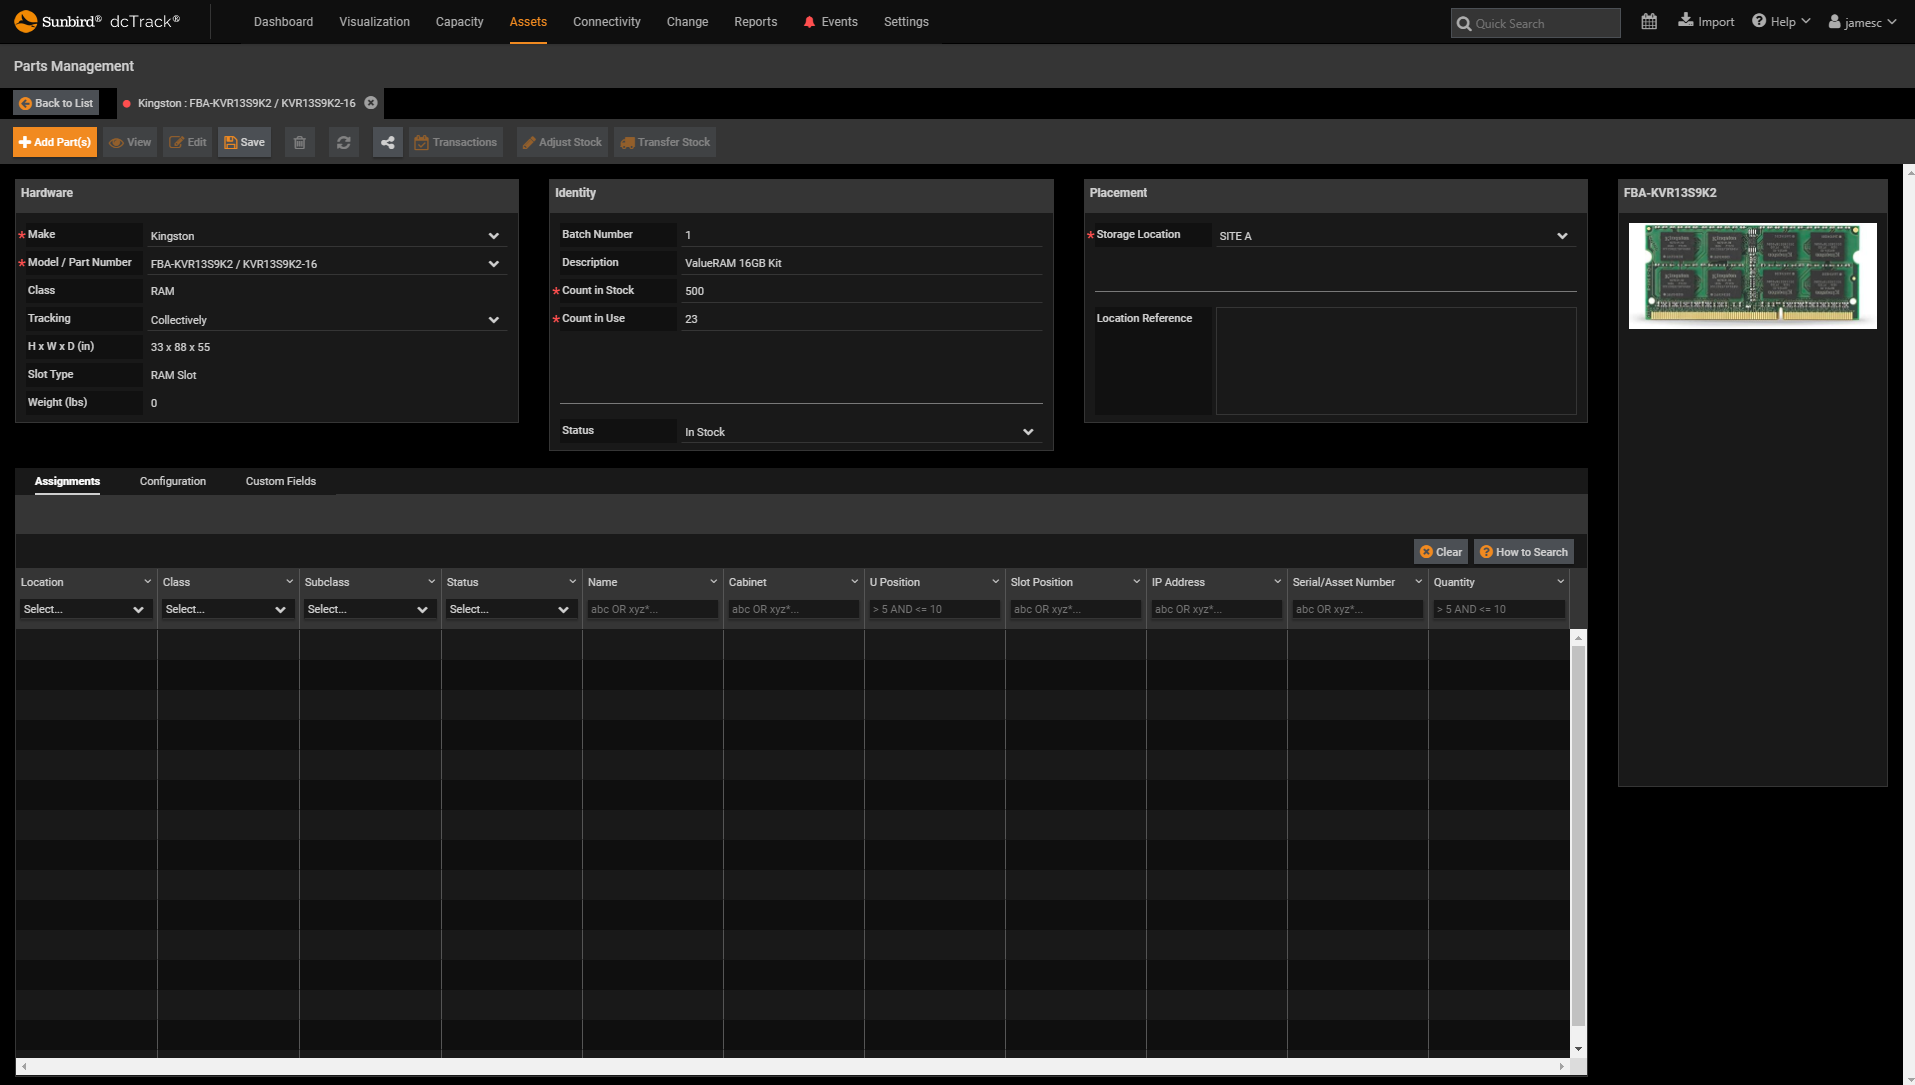
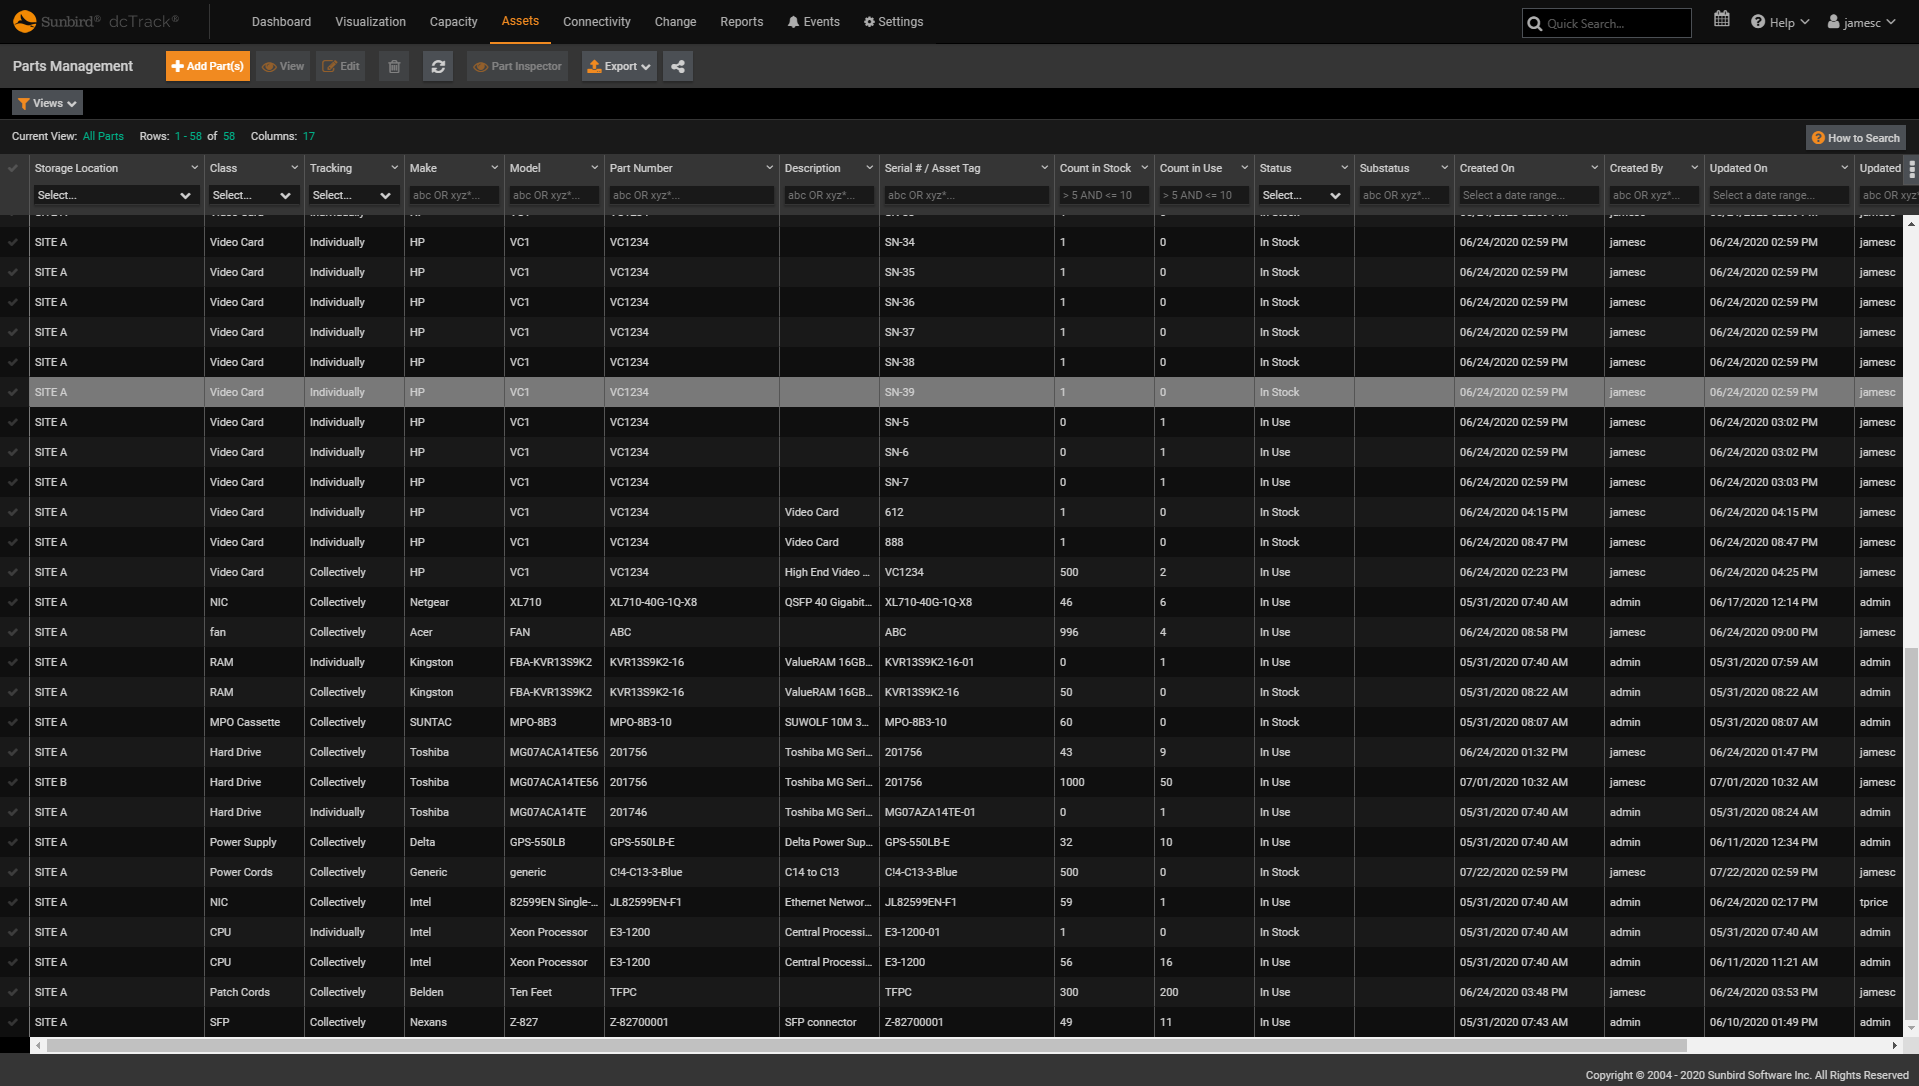
 dcTrack DCIM Operations | Asset ManagementParts Management
 -
dcTrack DCIM Operations | Connectivity ManagementImpact Analysis From Any Point in a Data or Power Circuit
-
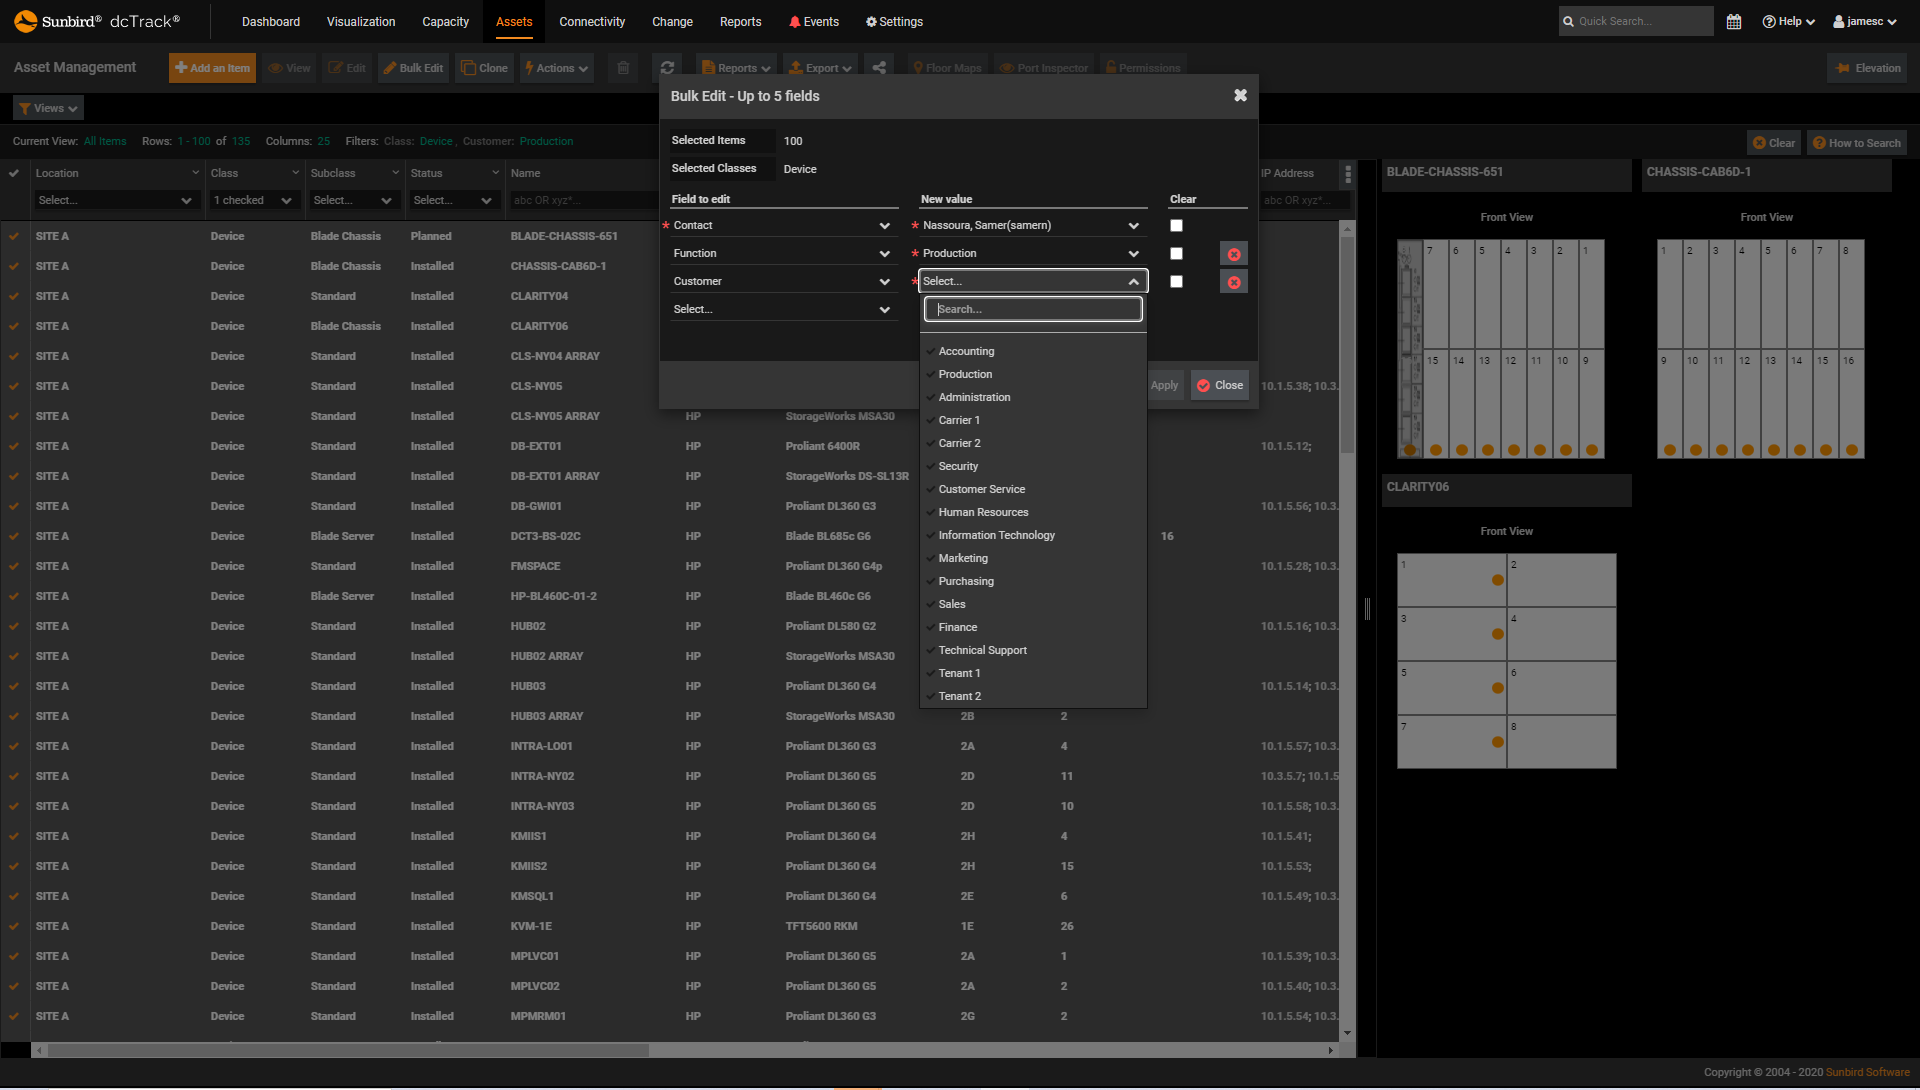
 dcTrack DCIM Operations | Asset ManagementBulk Edit Item Attributes
 -
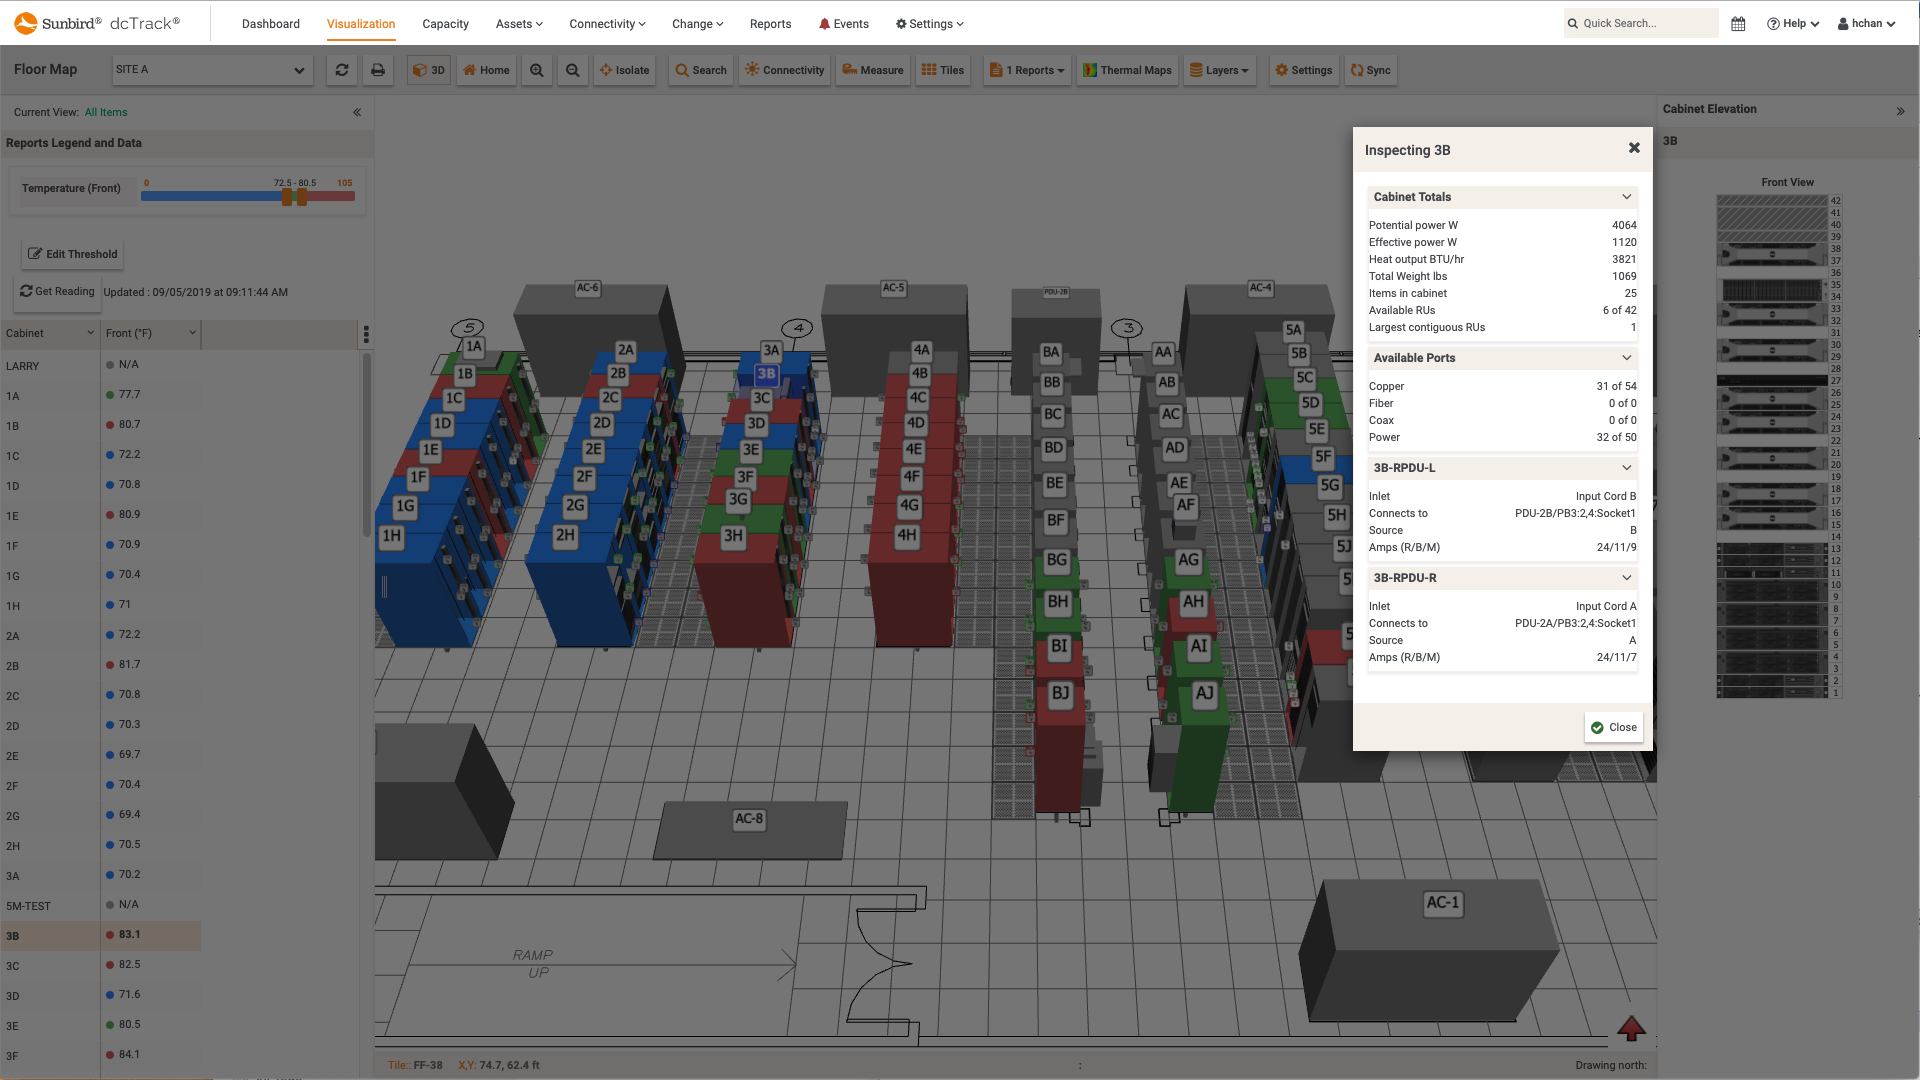
 dcTrack DCIM Operations | Asset Management | VisualizationCabinet Inspector
 -
 dcTrack DCIM Operations | Environment Management | VisualizationCabinet Inlet Temperature Report
 -
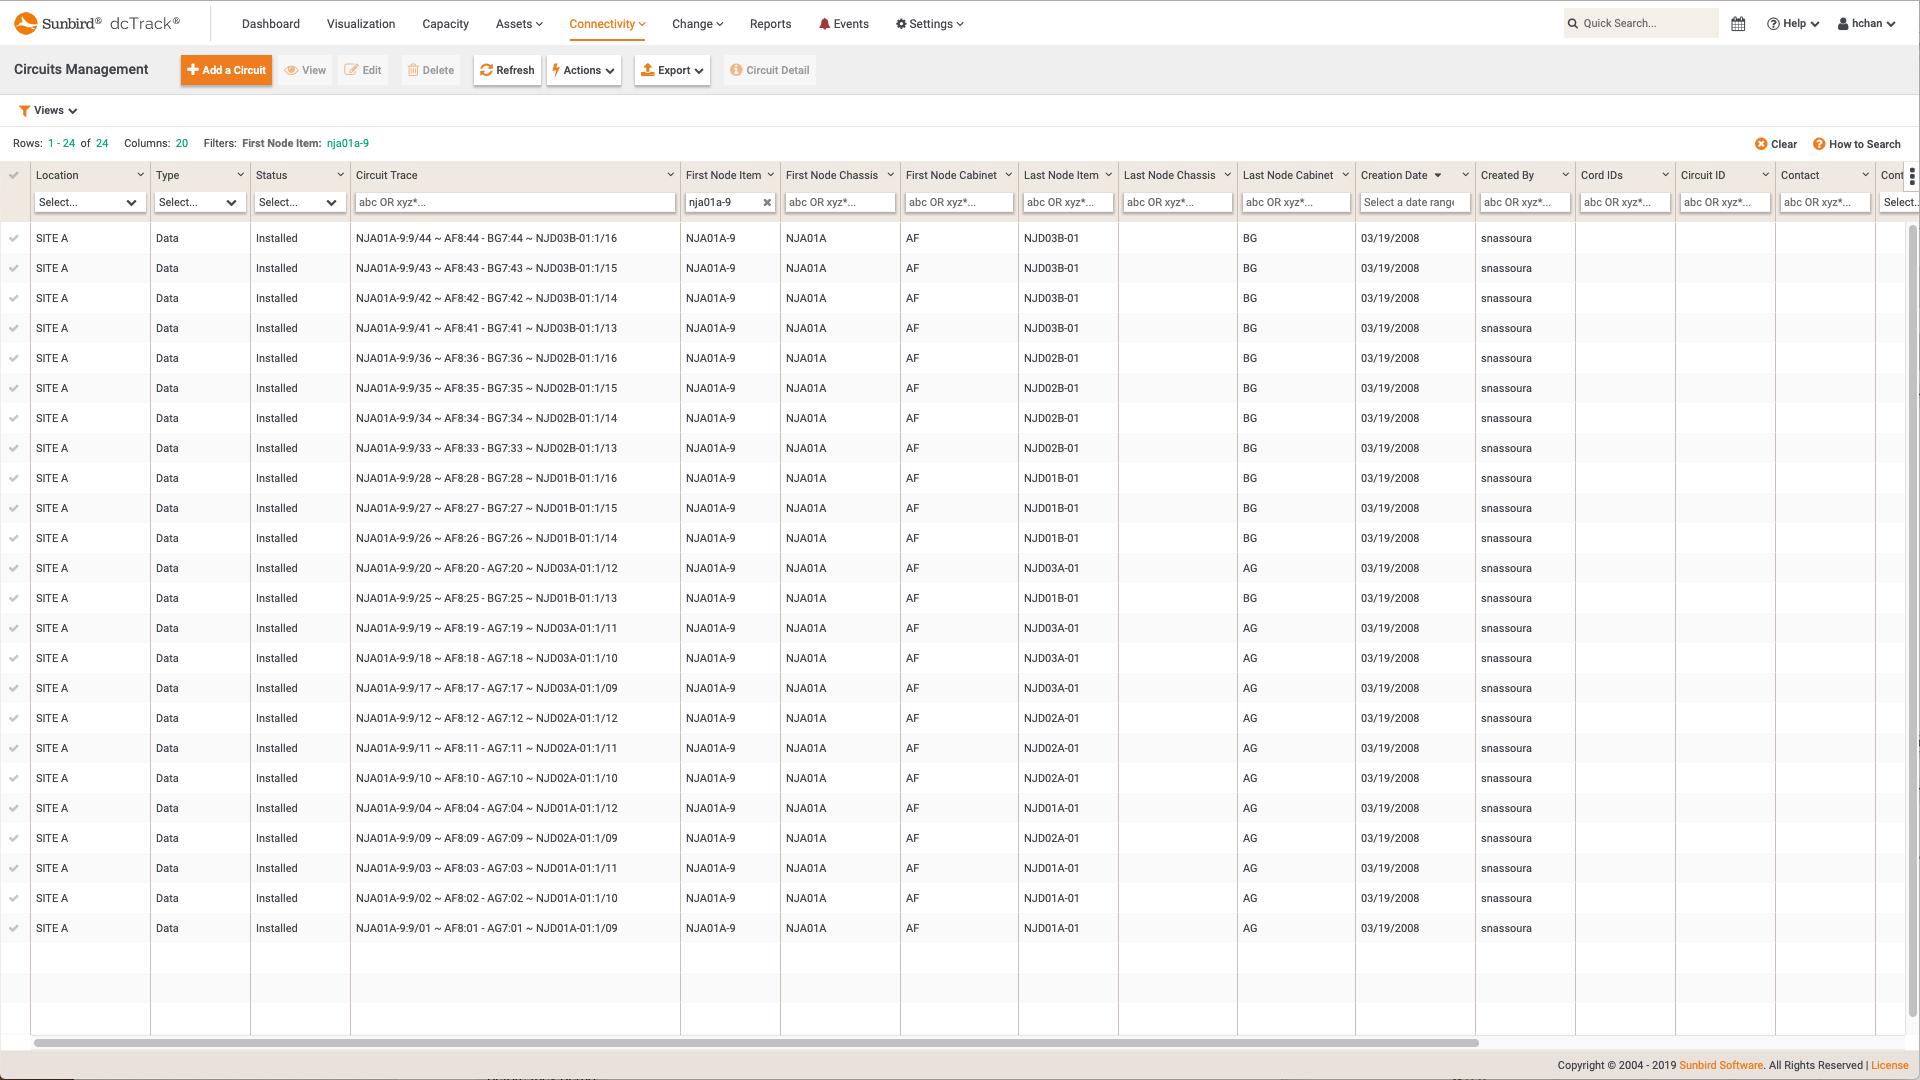
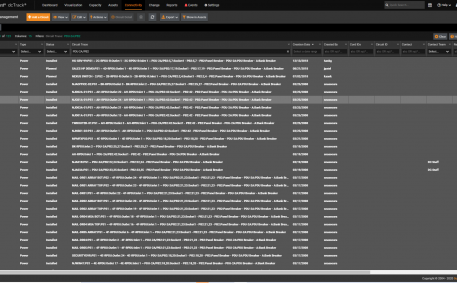
 dcTrack DCIM Operations | BI & Data AnalyticsCircuits Management
 -
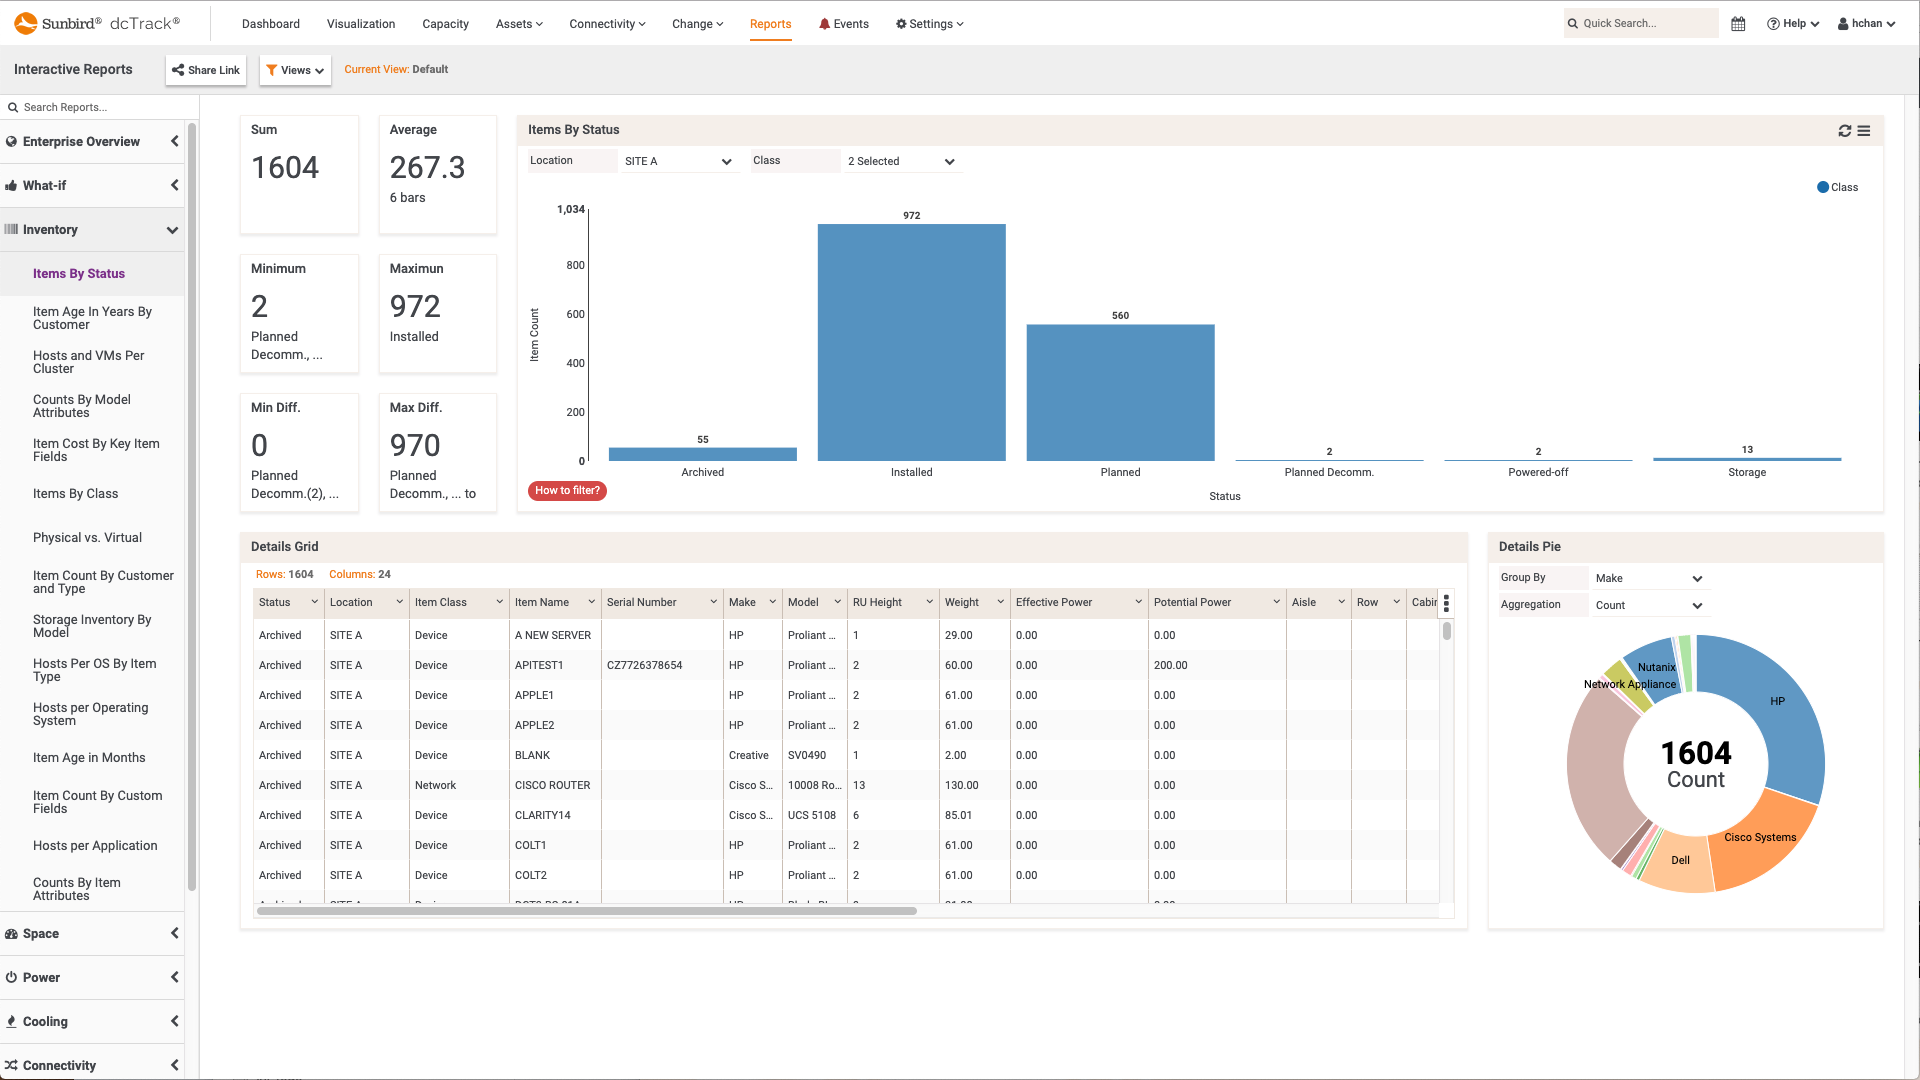
 dcTrack DCIM Operations | BI & Data Analytics | DashboardsZero-Configuration Interactive Reports and Visual Analytics
 -
 dcTrack DCIM Operations | Asset ManagementSave and Share Filtered Views
 -
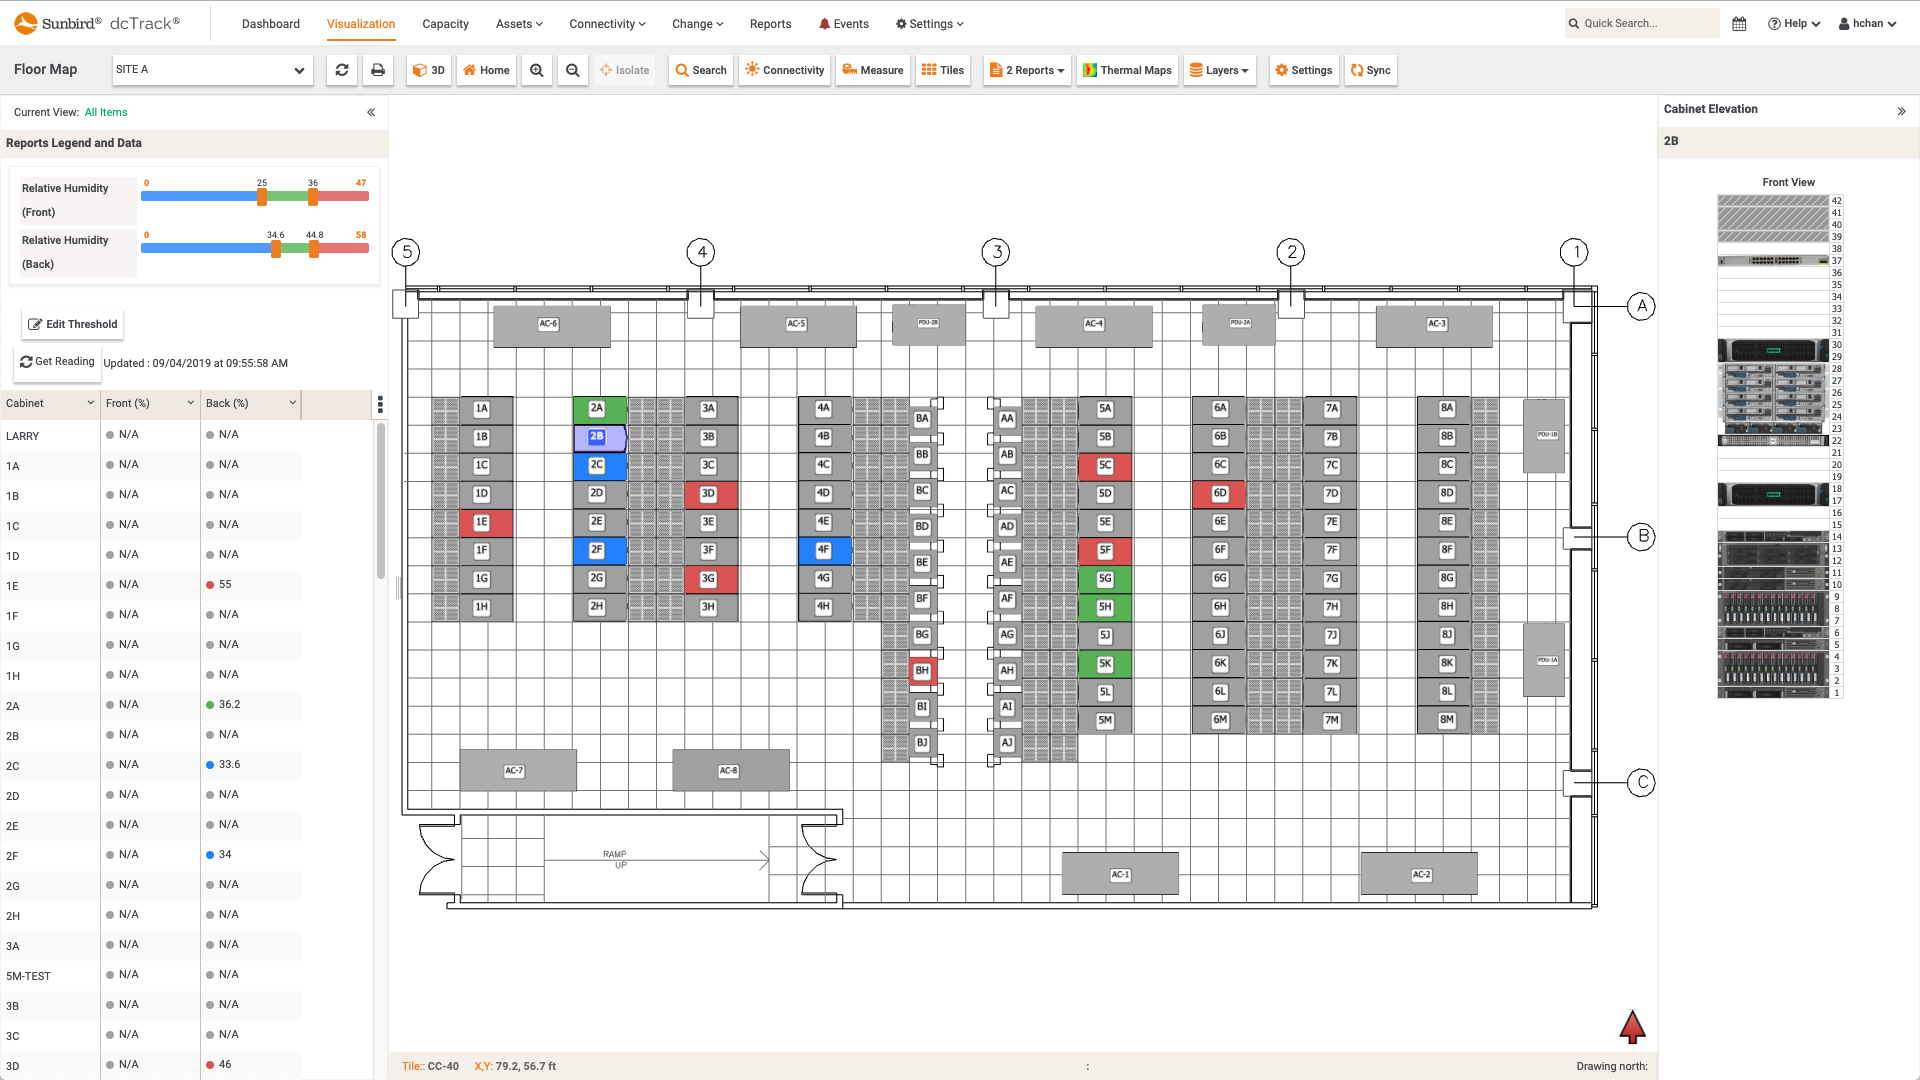
 dcTrack DCIM Operations | Environment Management | BI & Data Analytics | VisualizationRelative Humidity per Cabinet Floor Map Report
 -
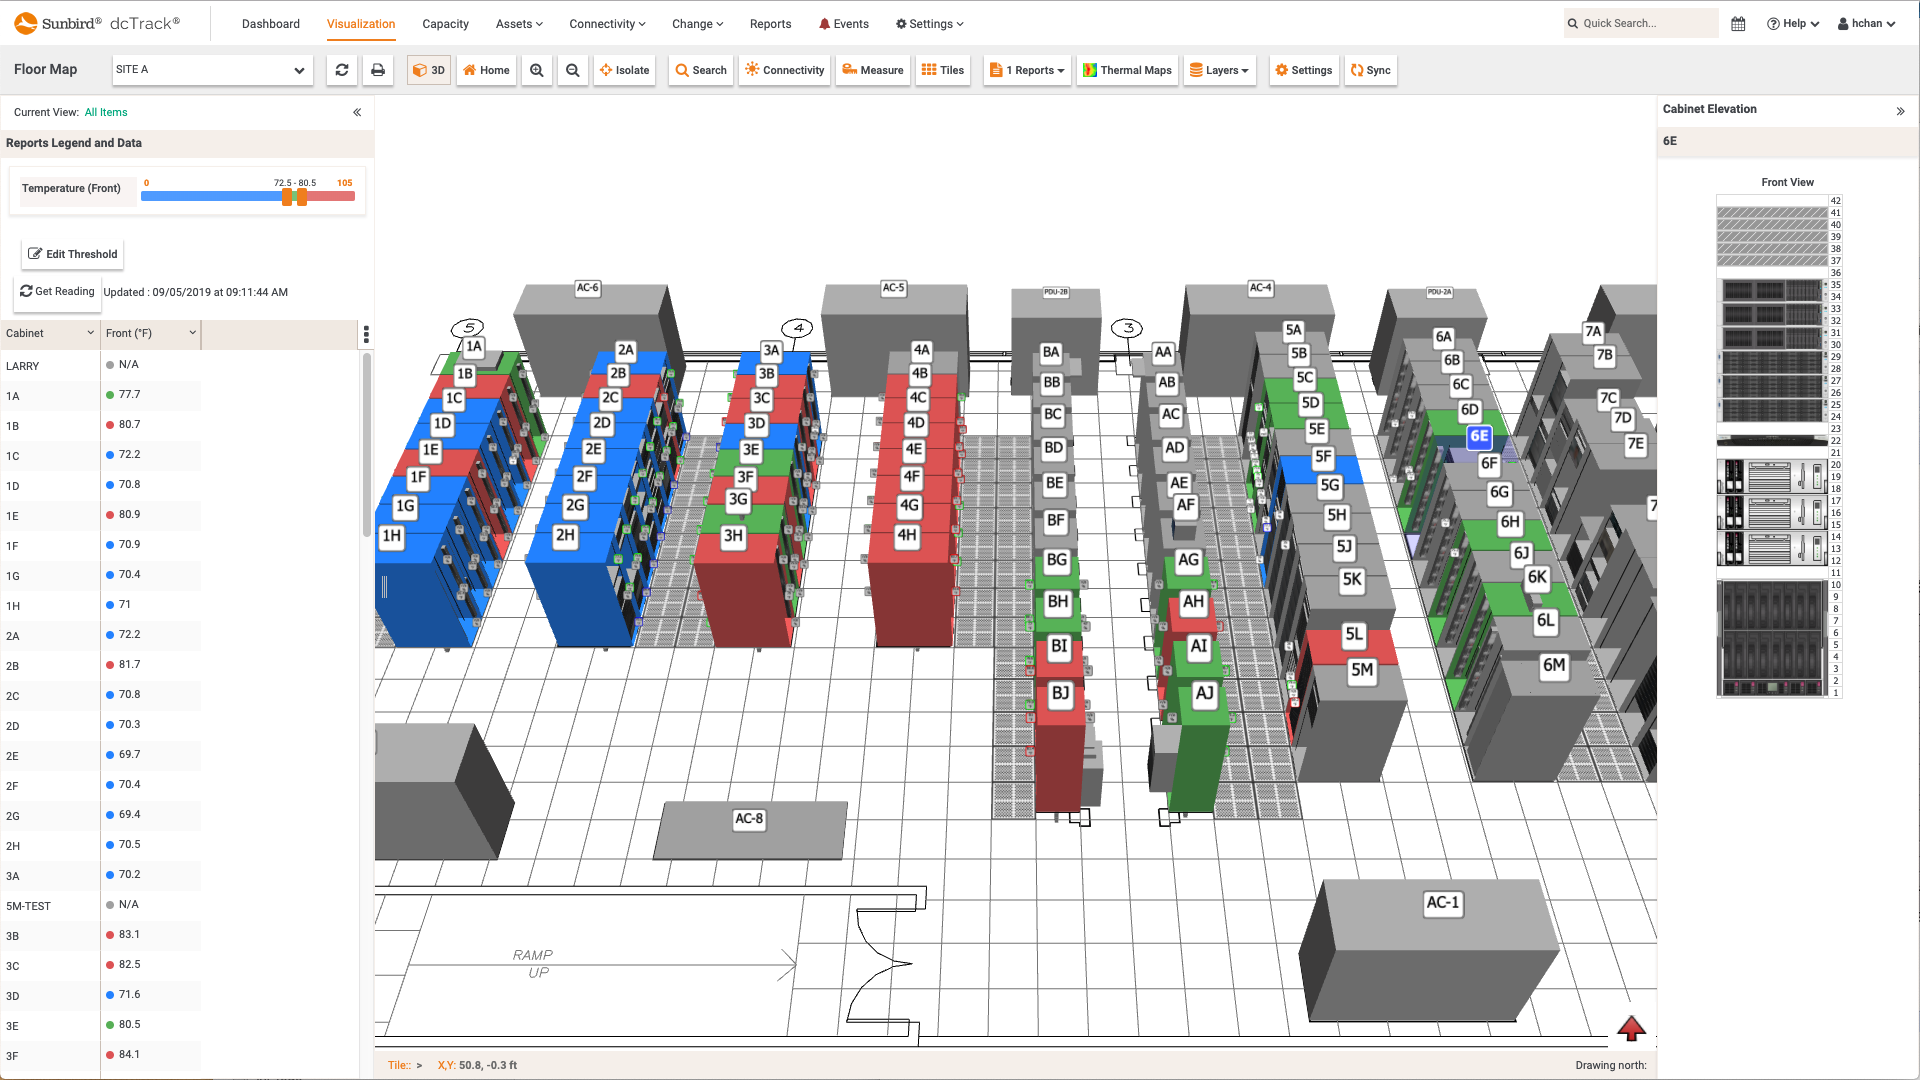
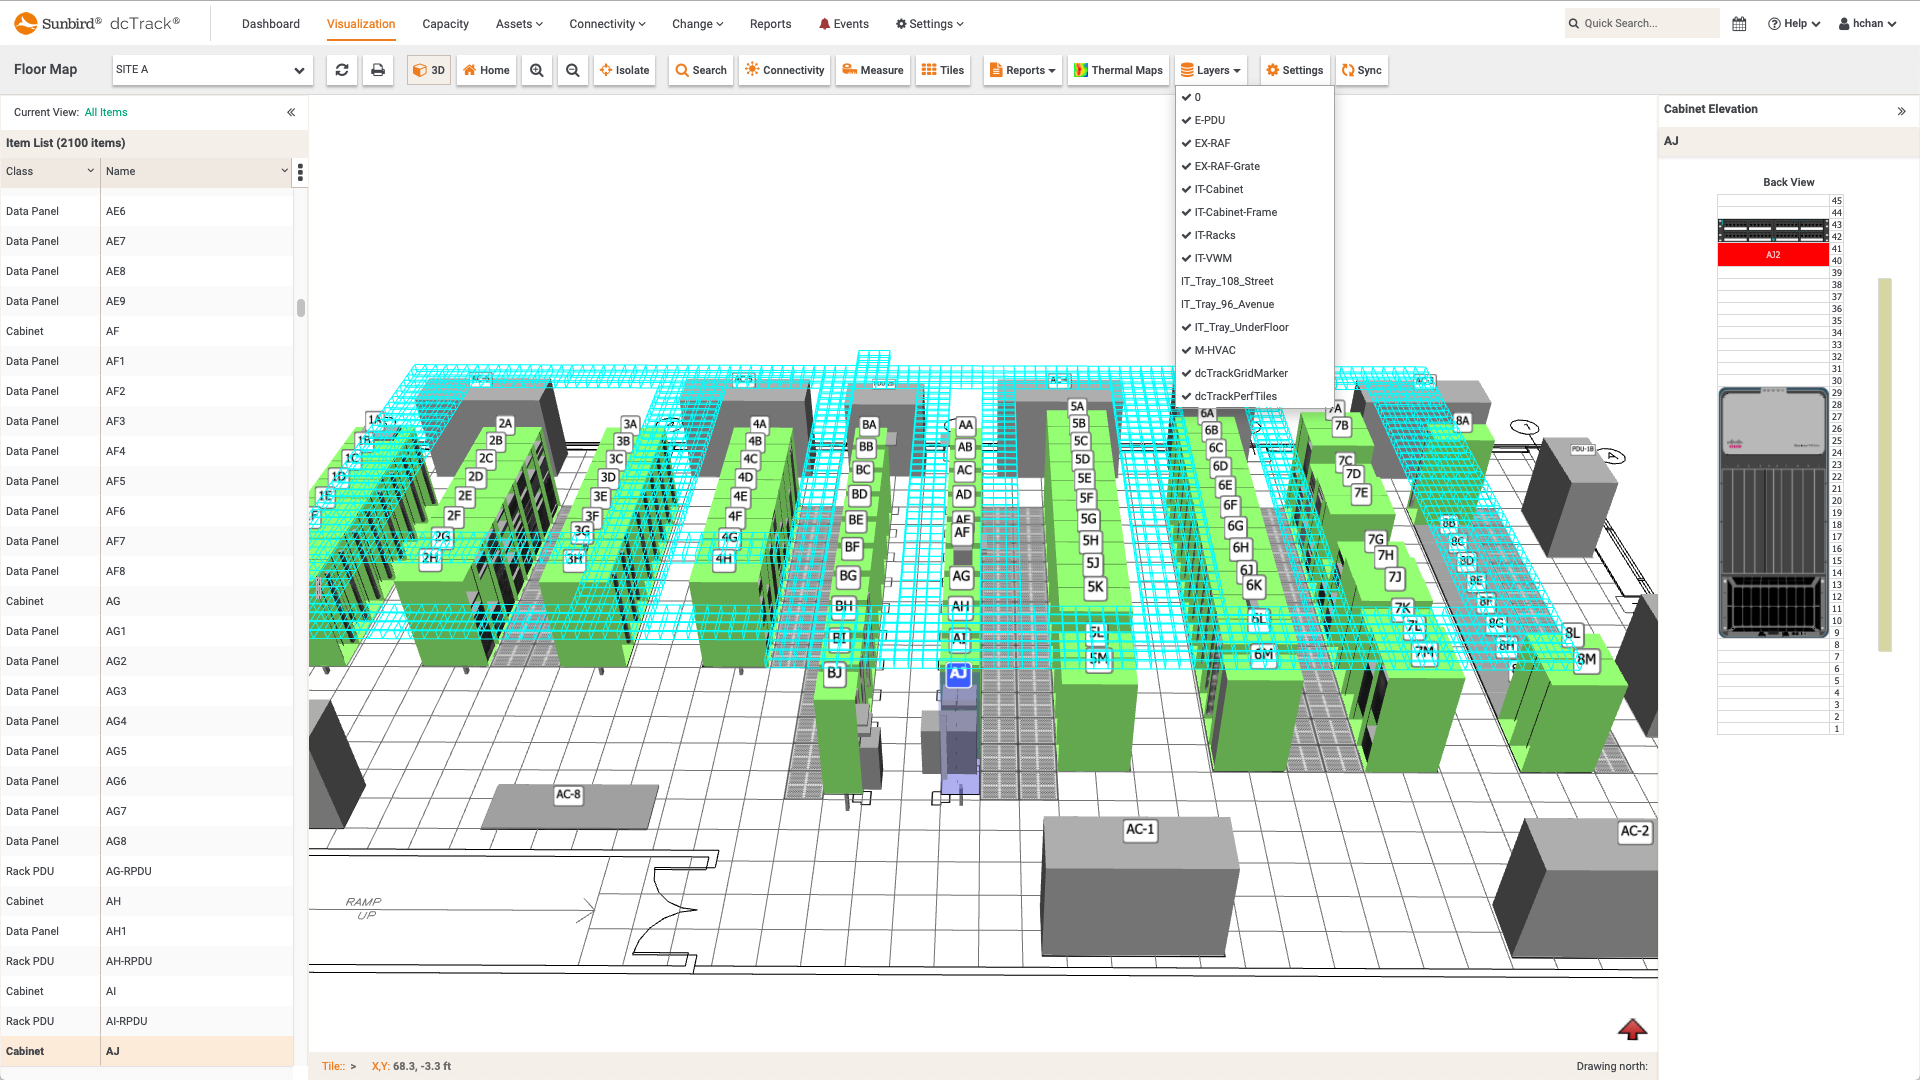
 dcTrack DCIM Operations | VisualizationCabinet Elevations
 -
 dcTrack DCIM Operations | Power Management | Dashboards | BI & Data AnalyticsPower Dashboard
 -
 dcTrack DCIM Operations | Asset ManagementNetwork Line Card Item Details
 -
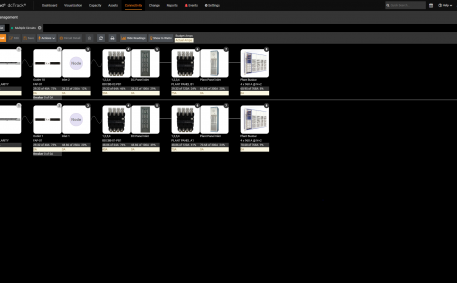
 dcTrack DCIM Operations | Asset Management | VisualizationMulti-Select Cabinet Elevation Views From Any Site and Row
 -
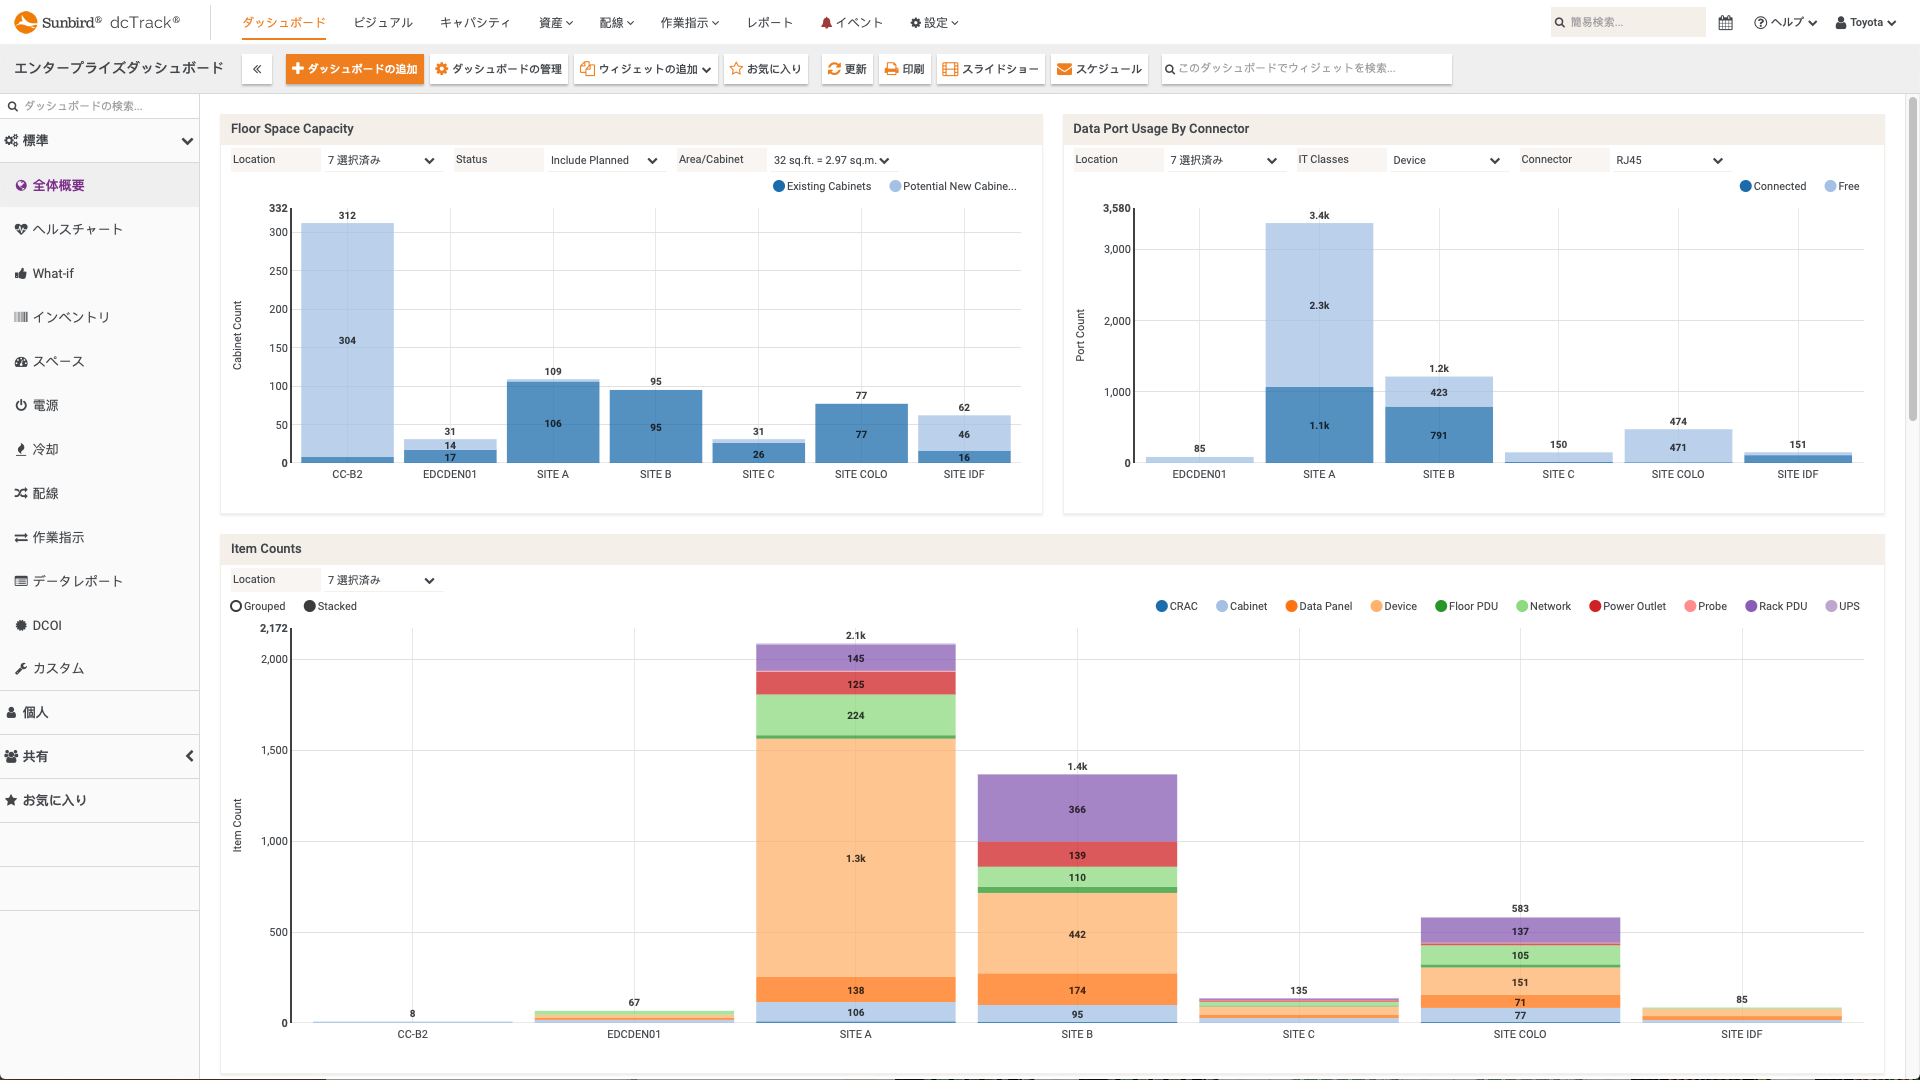
 dcTrack DCIM OperationsGUI Localization - Japanese
 -
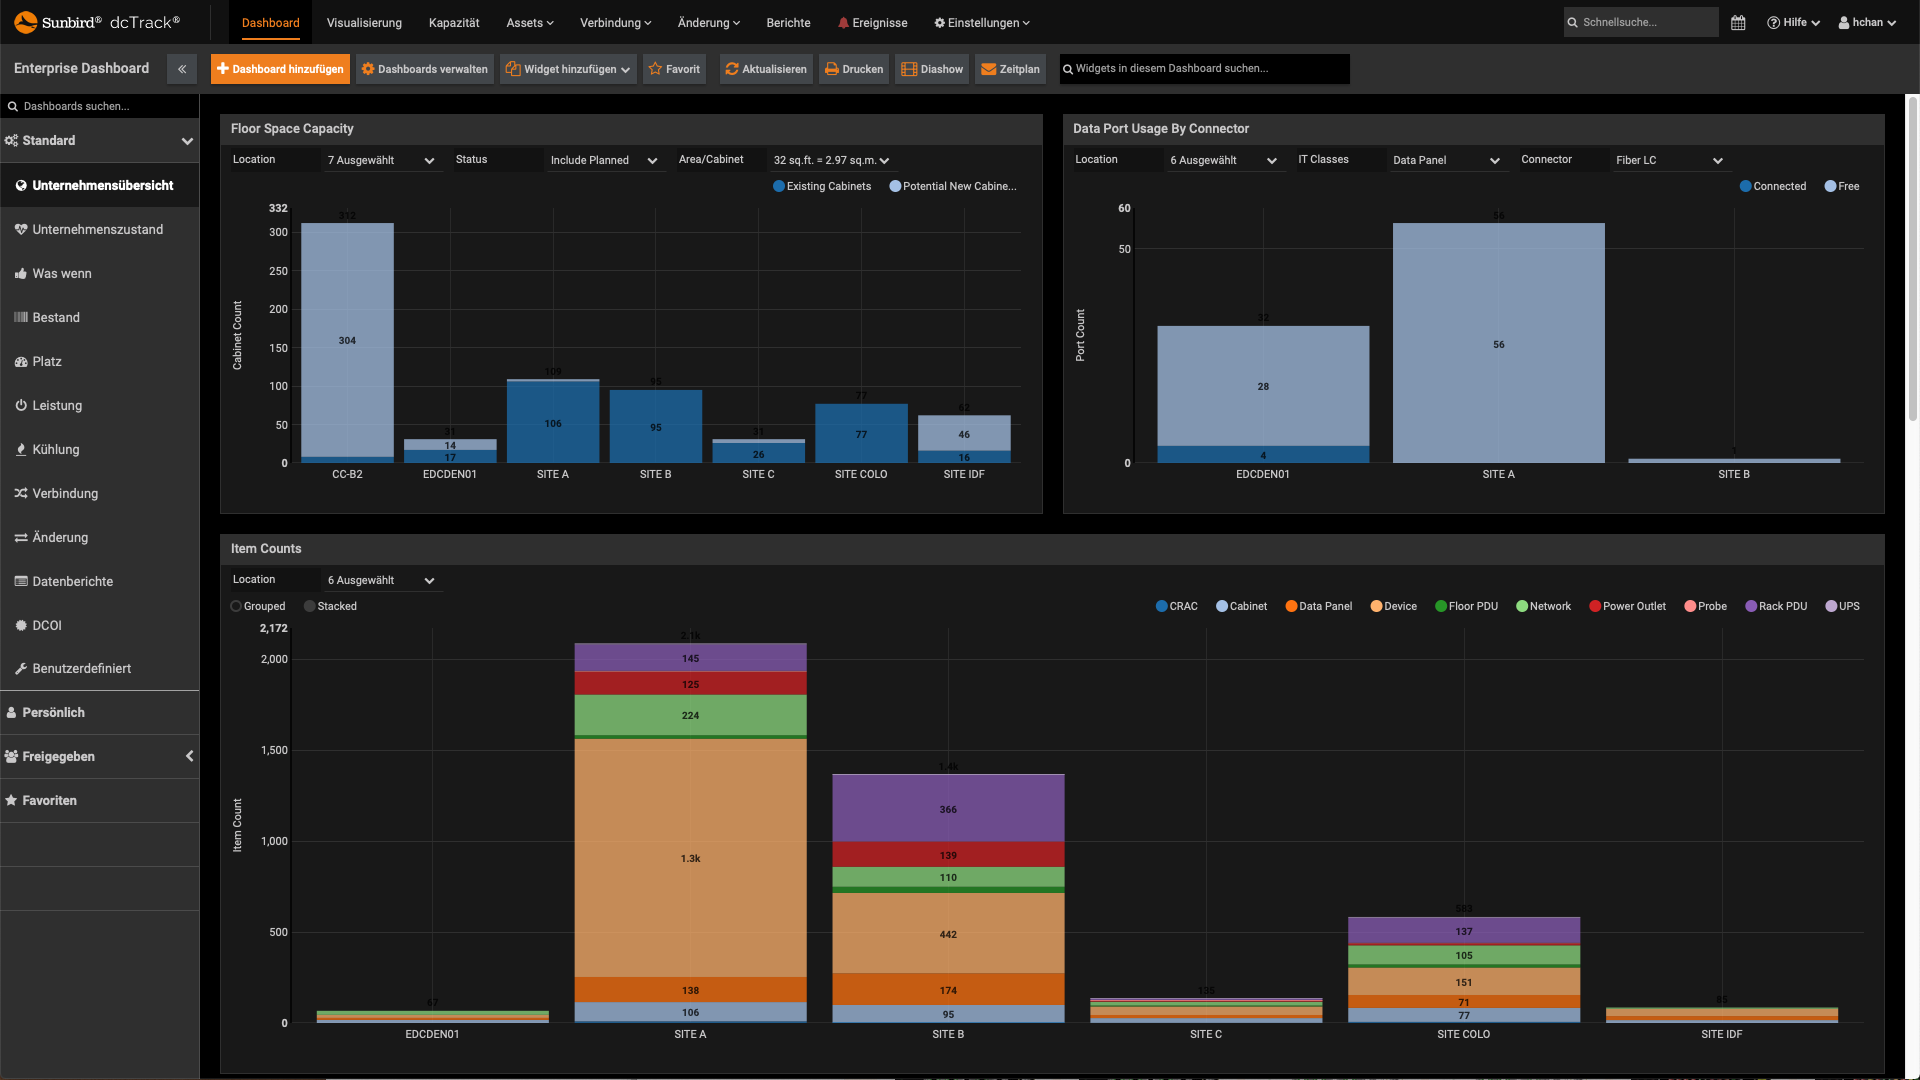
 dcTrack DCIM OperationsGUI Localization - German
 -
 dcTrack DCIM OperationsGUI Localization - French
 -
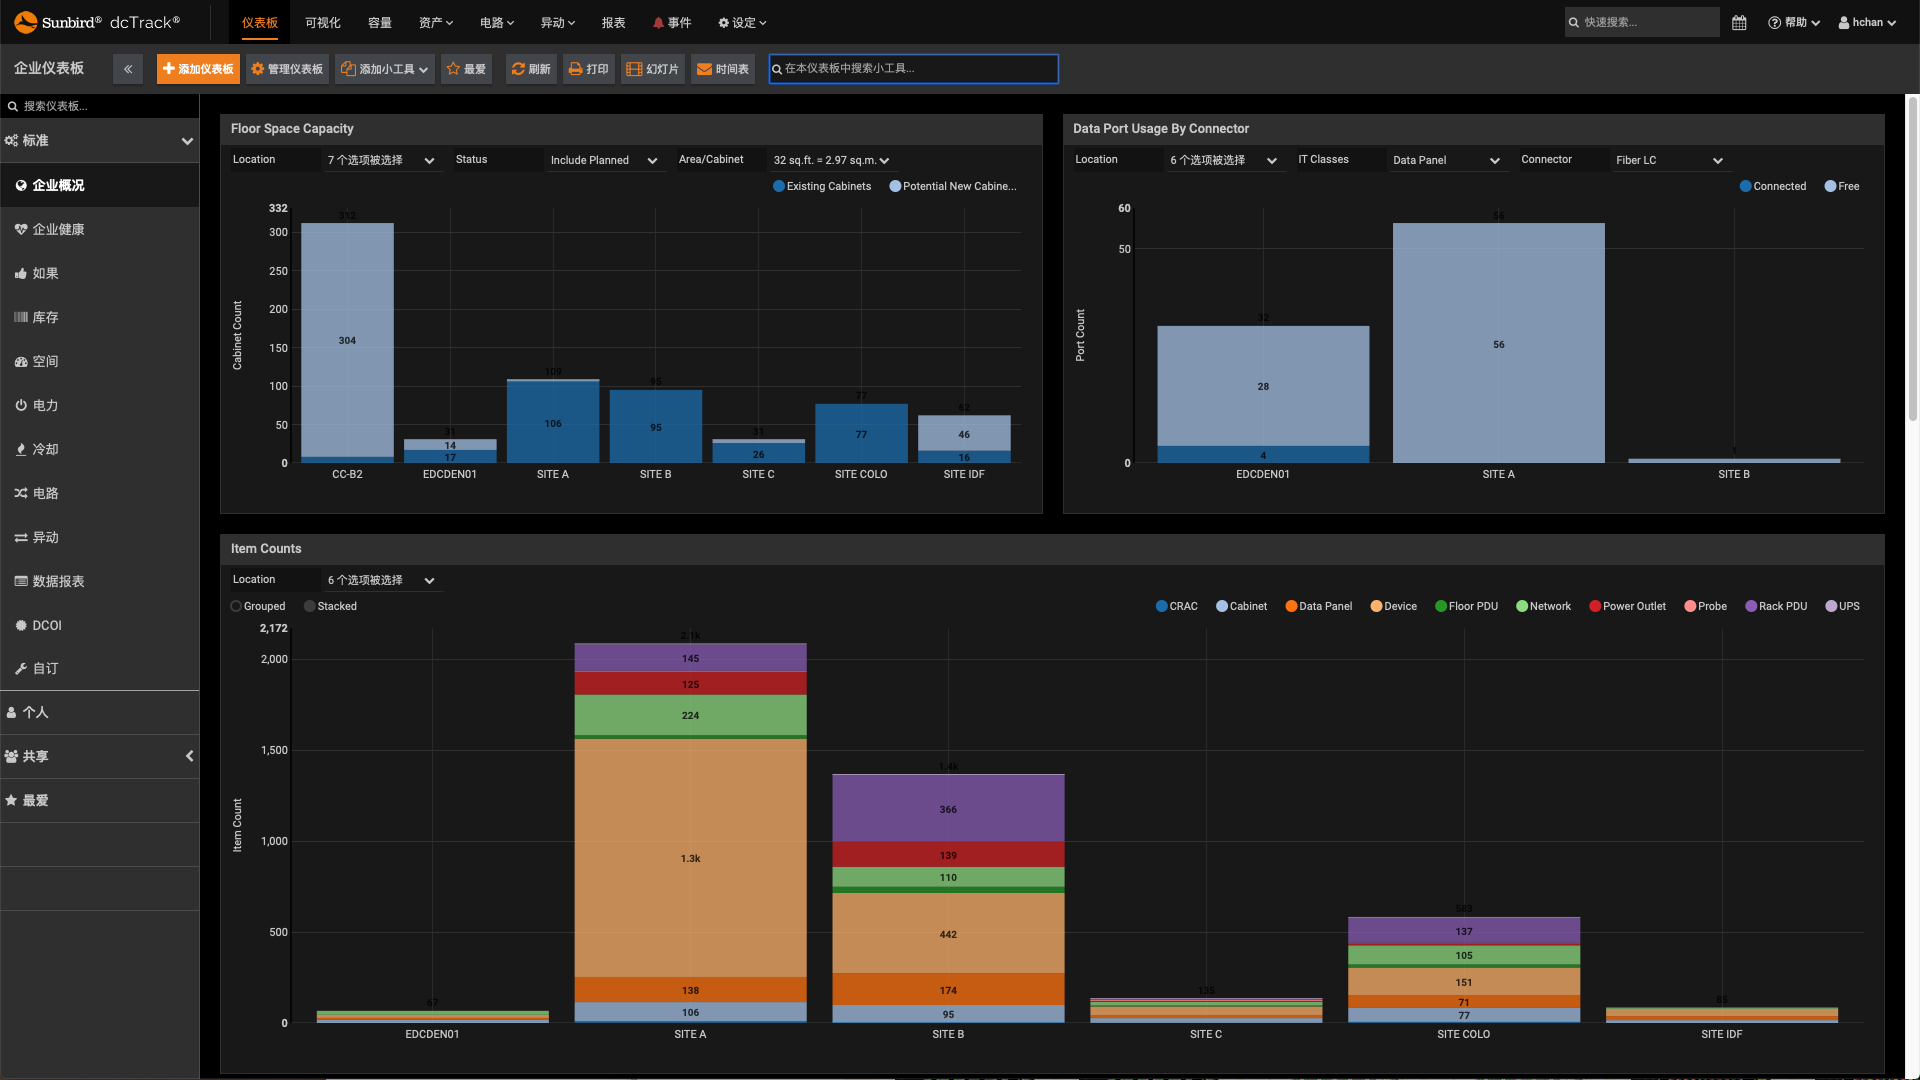
 dcTrack DCIM OperationsGUI Localization - Chinese
 -
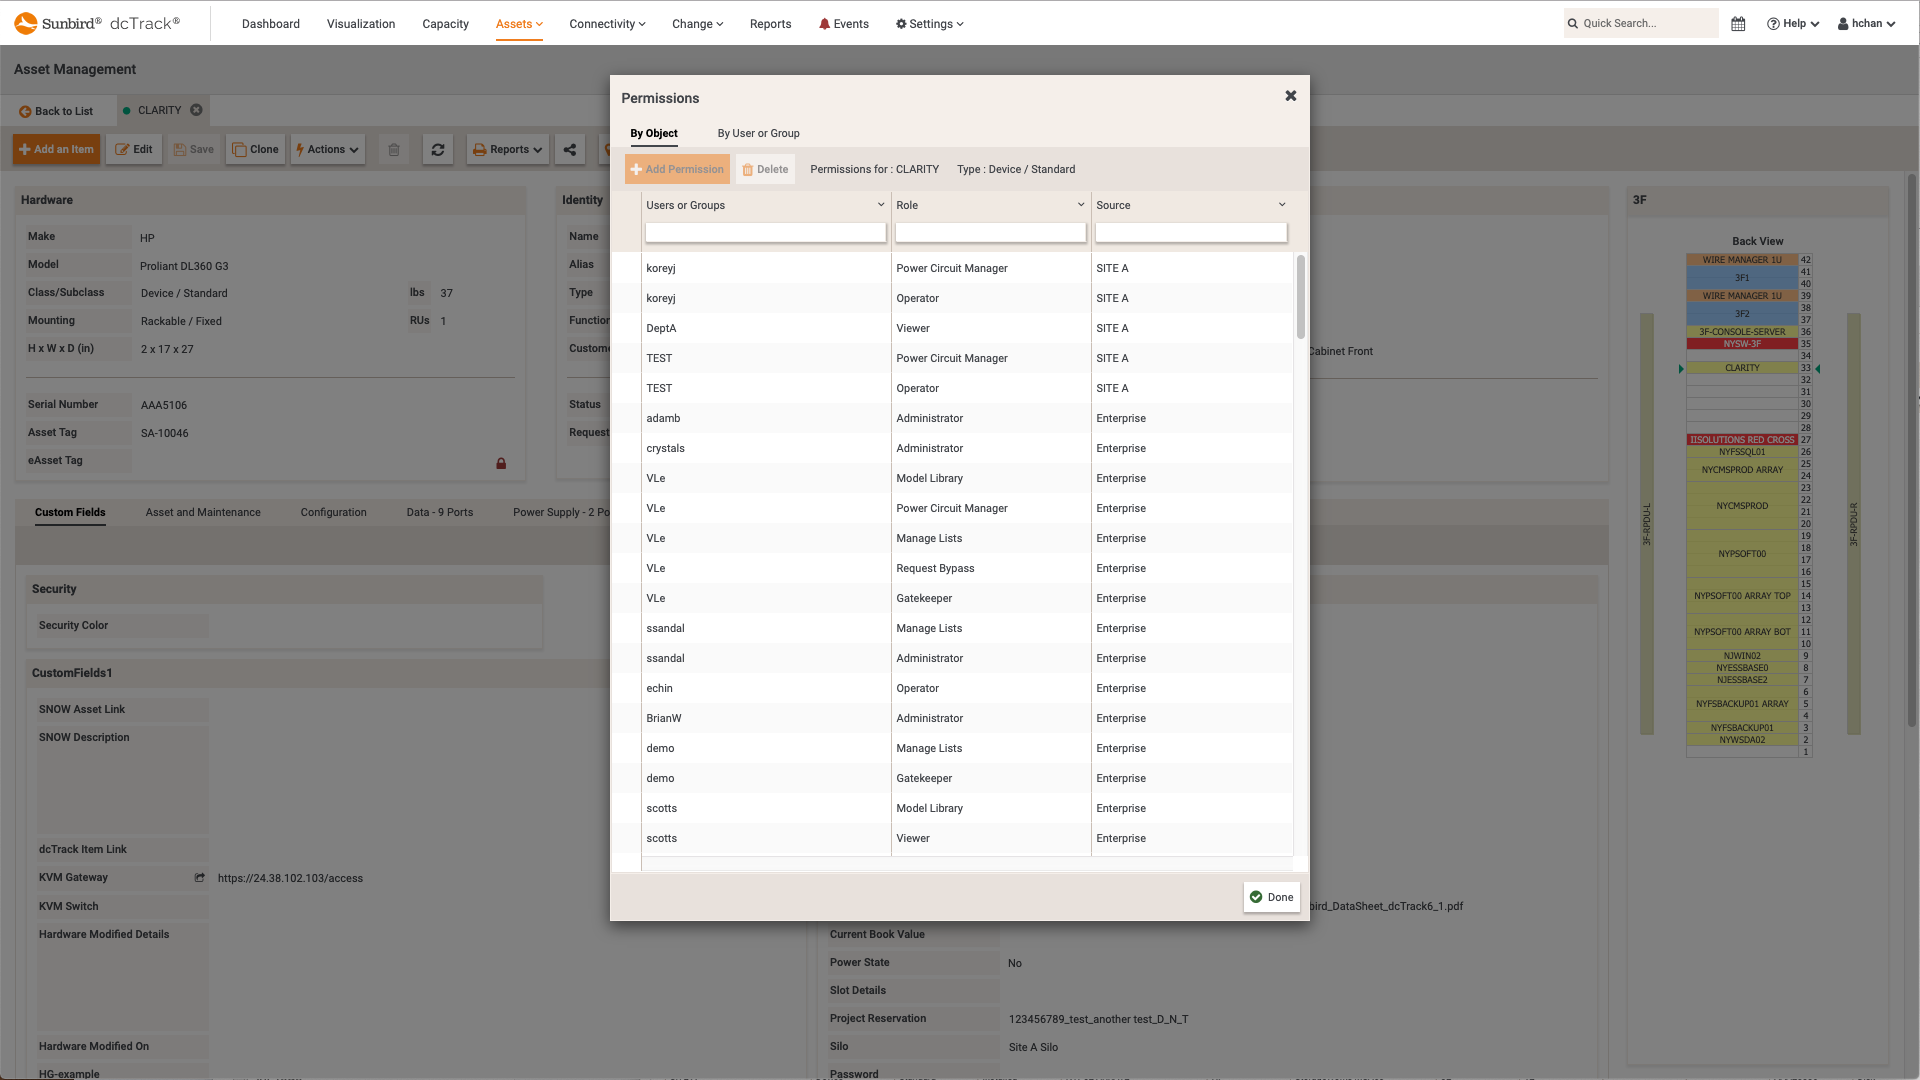
 dcTrack DCIM Operations | Asset ManagementGranular Permissions per Inventory Item
 -
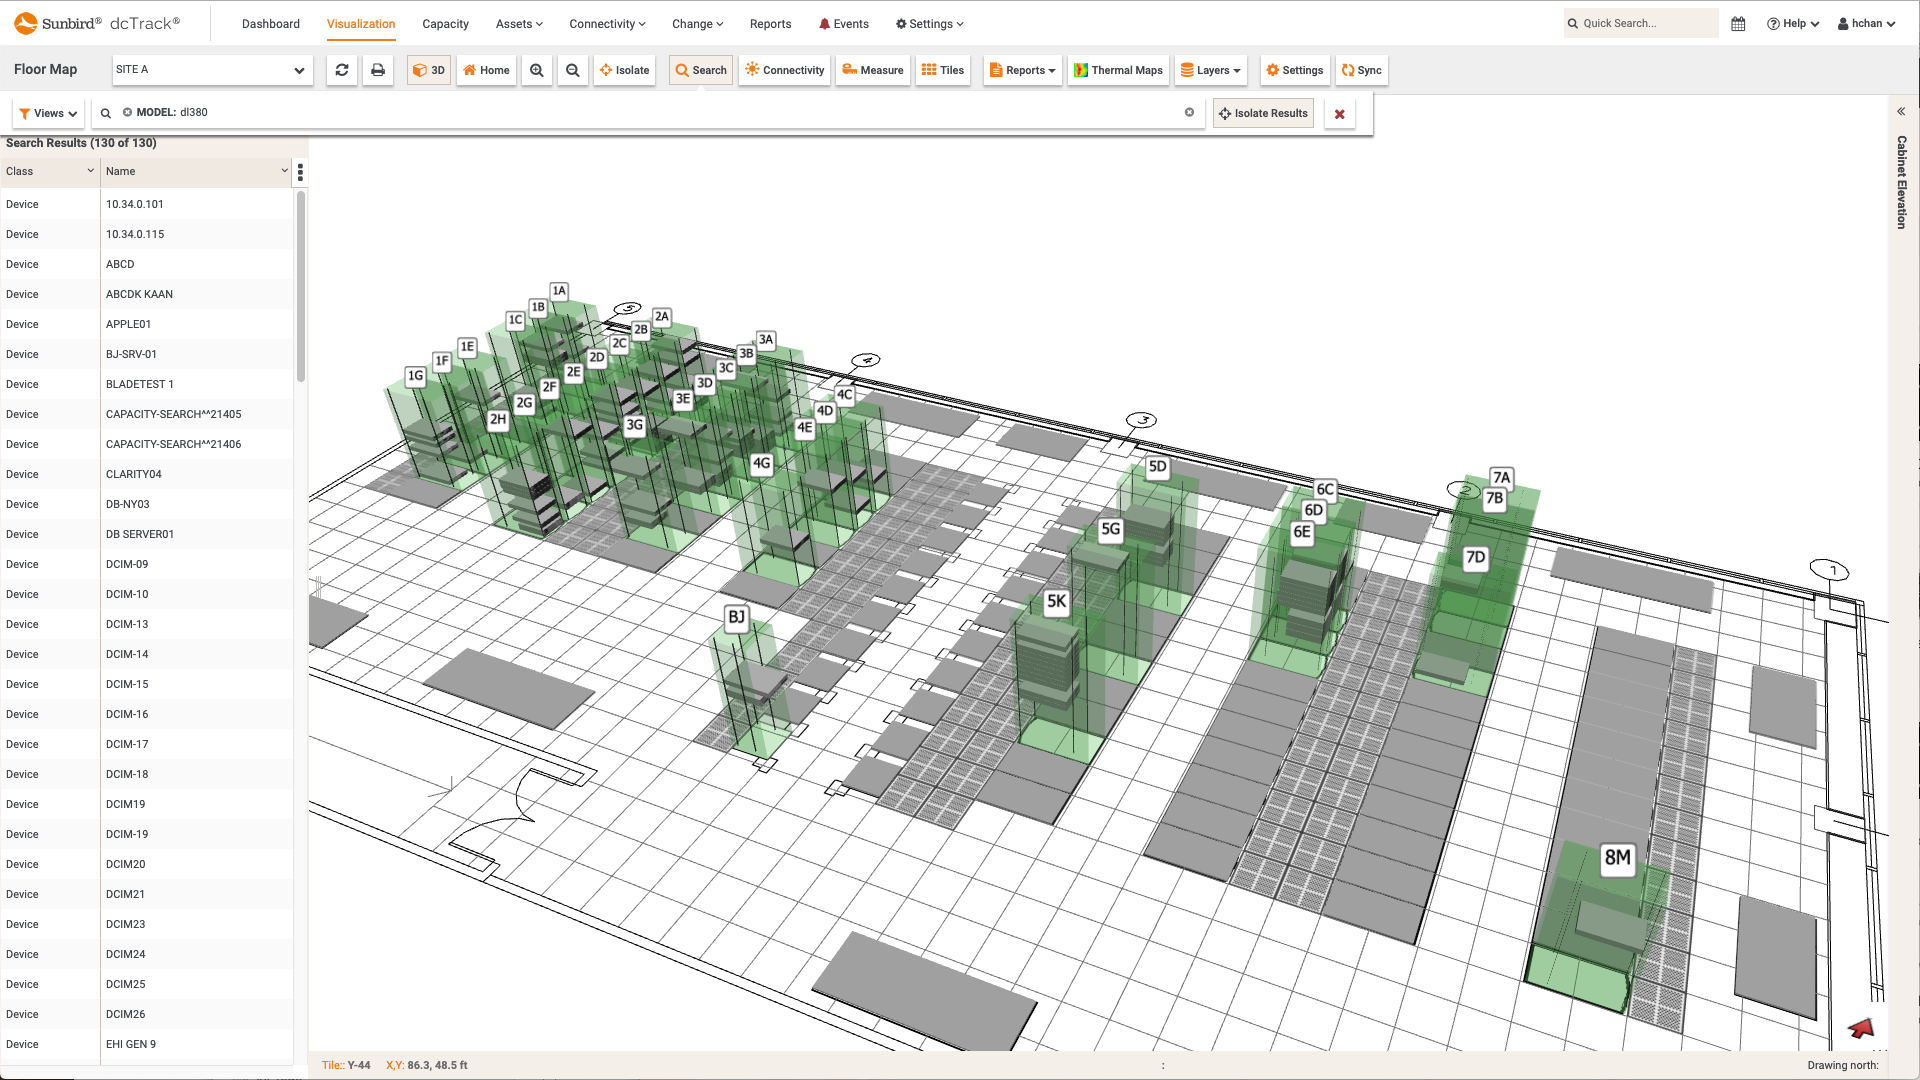
 dcTrack DCIM Operations | Asset Management | VisualizationFiltered 3D Search of All Server Models
 -
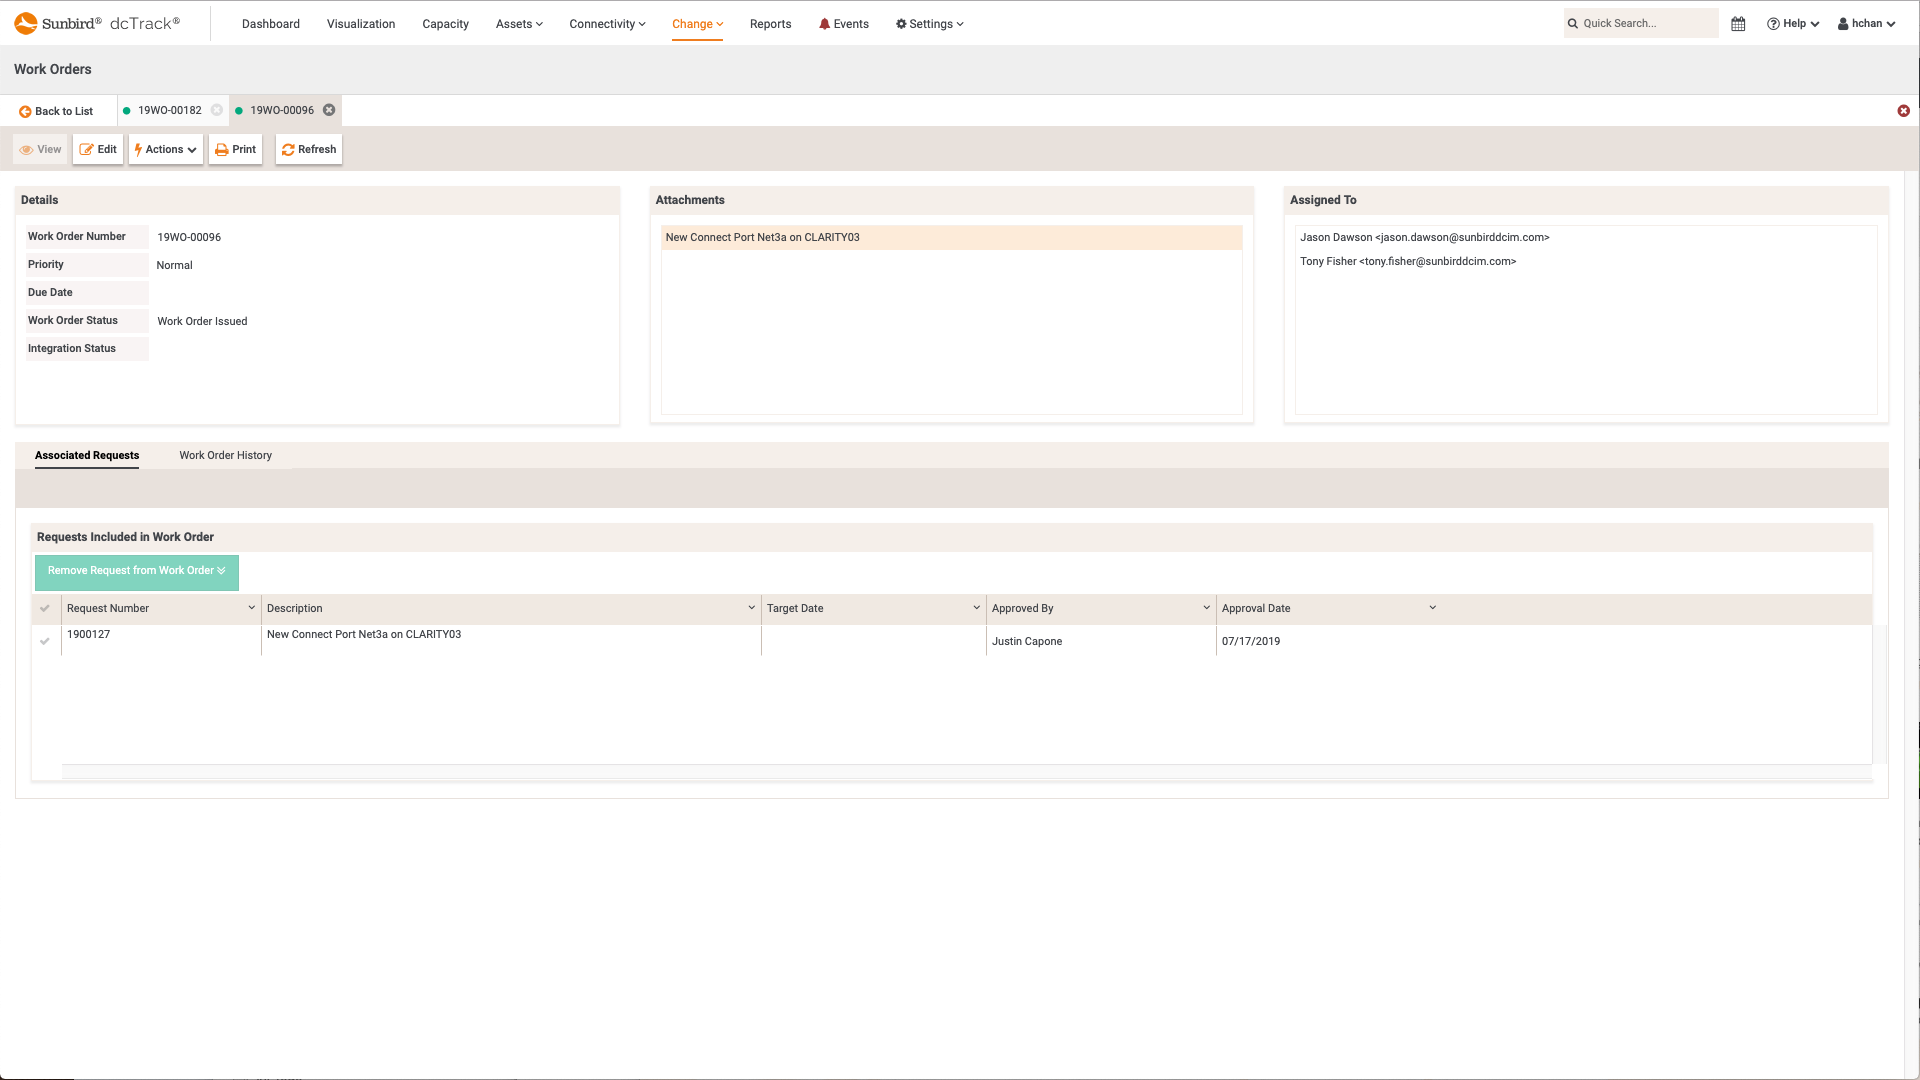
 dcTrack DCIM Operations | Change ManagementFilter, View, and Edit Requests and Work Orders
 -
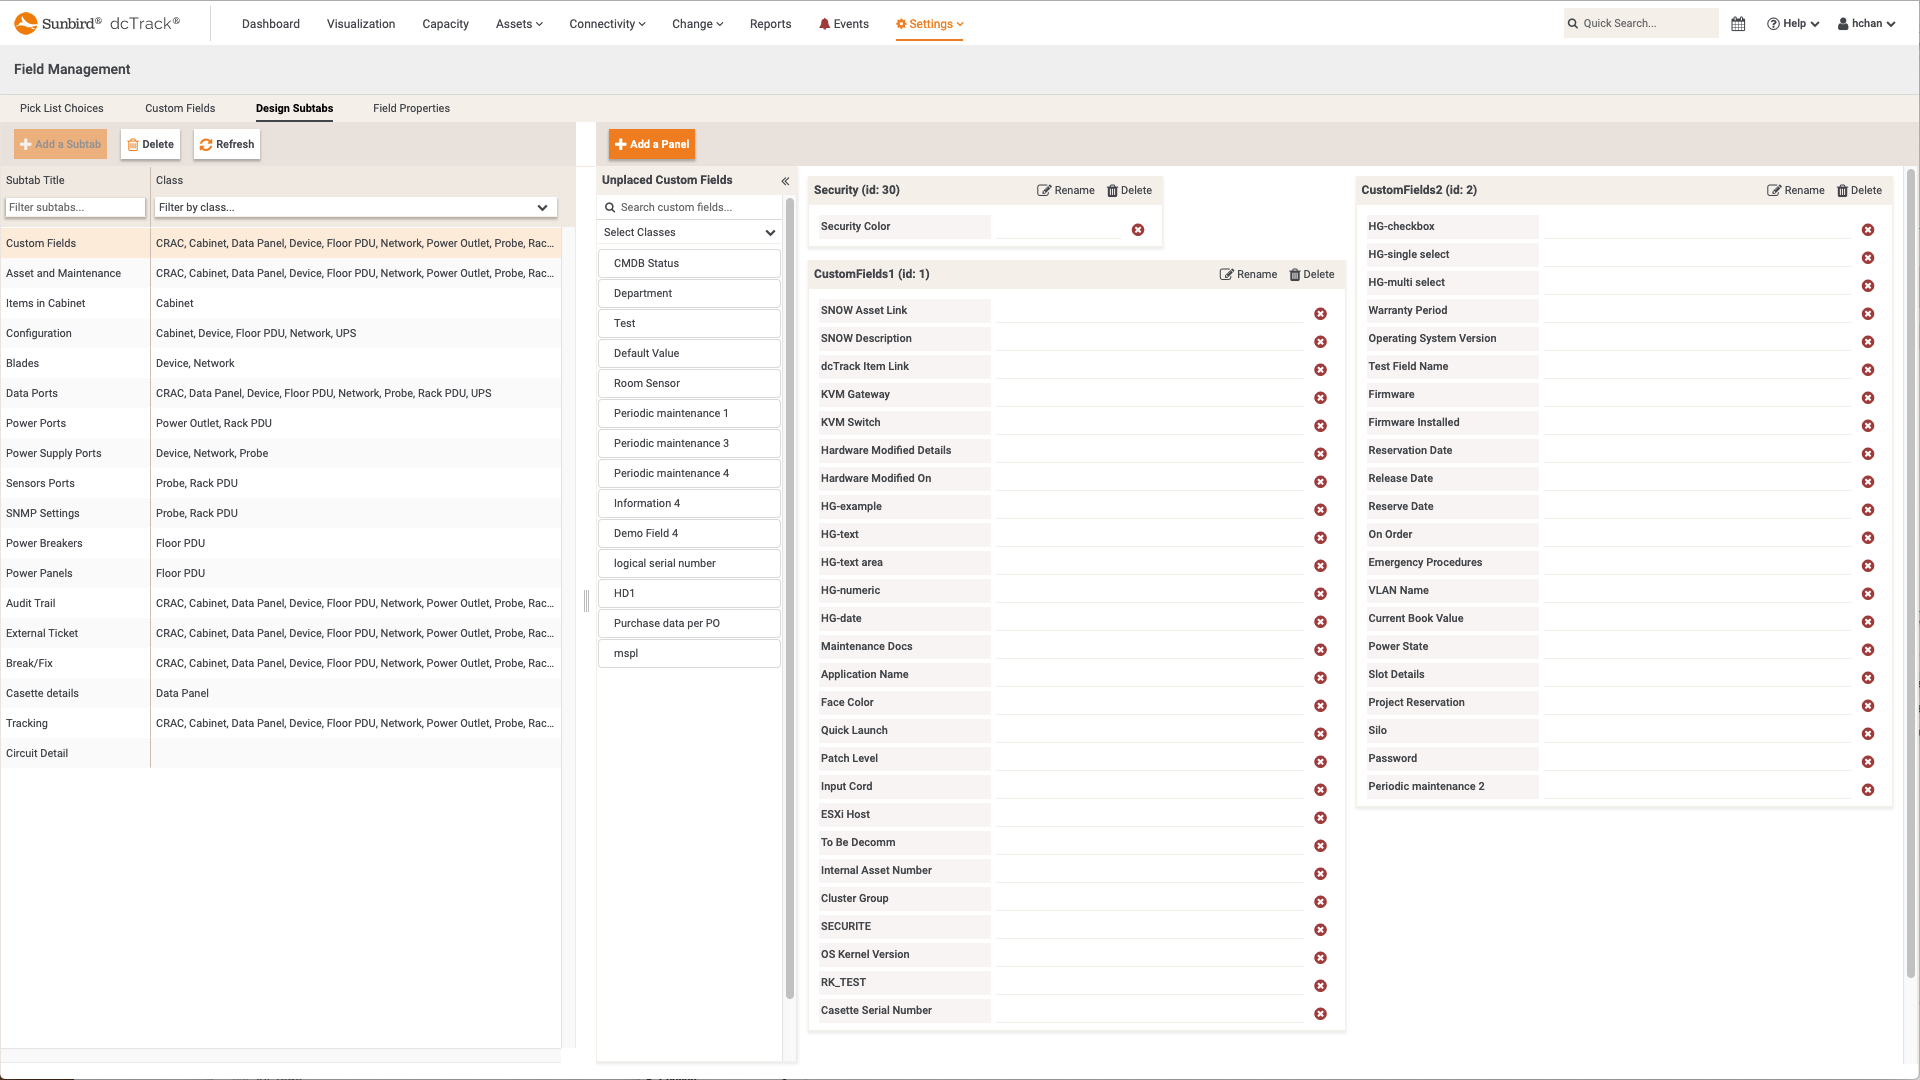
 dcTrack DCIM OperationsCustom Fields, Pick List Choices, Tabs, and Panels
 -
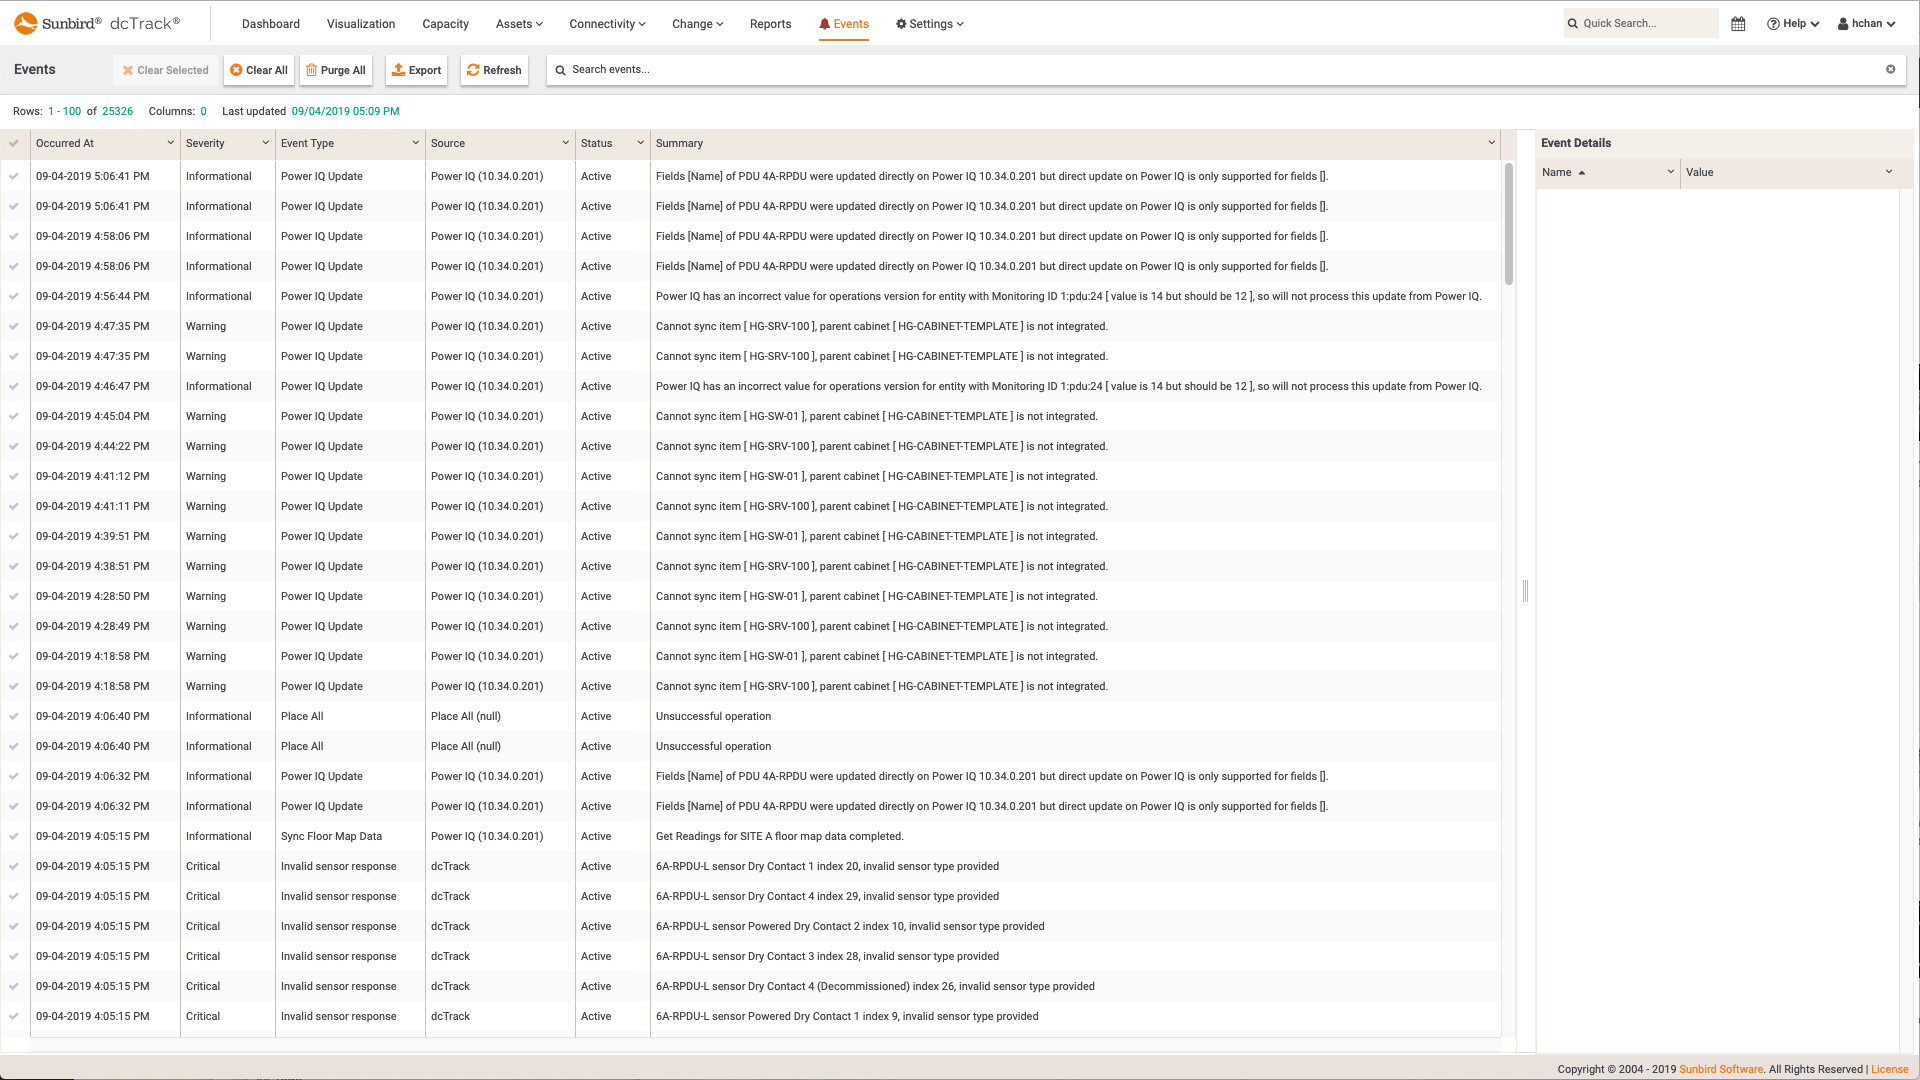
 dcTrack DCIM OperationsConsolidated Event Management Tab
 -
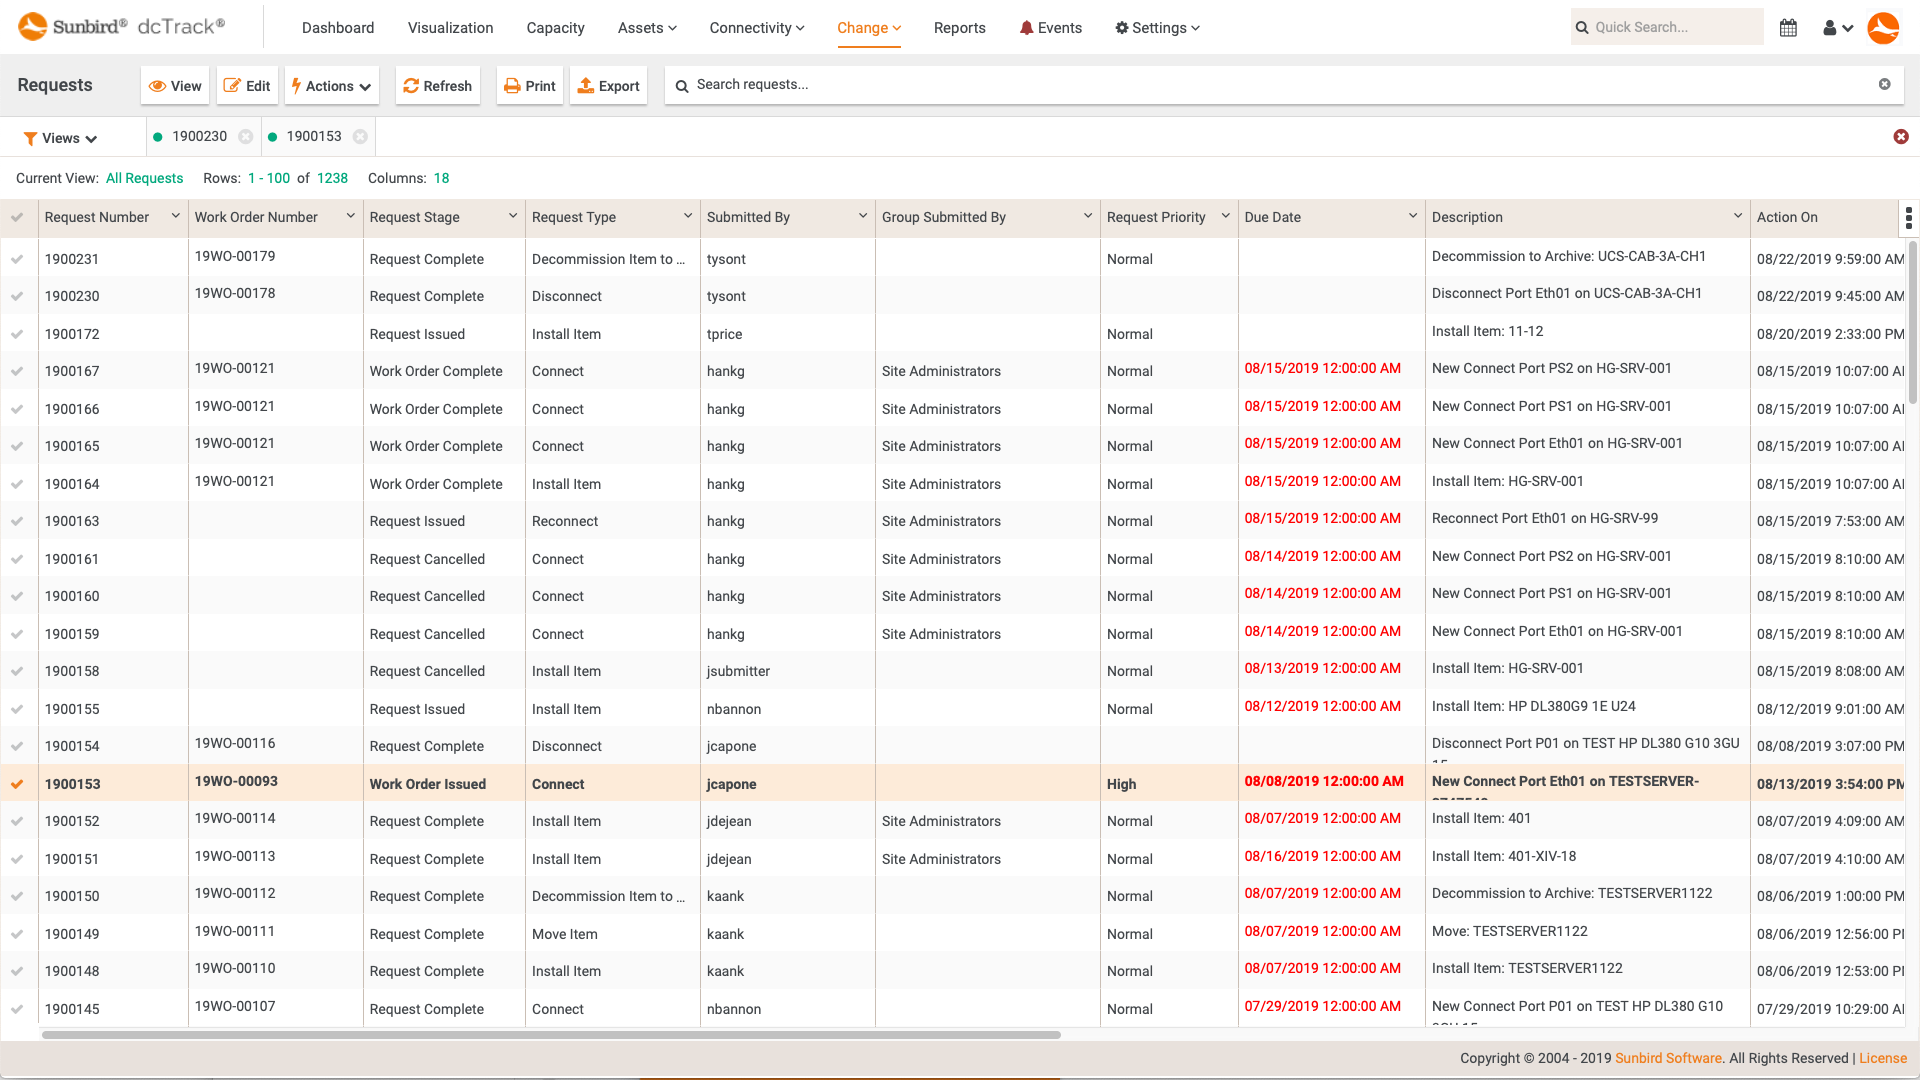
 dcTrack DCIM Operations | Change ManagementChange Requests
 -
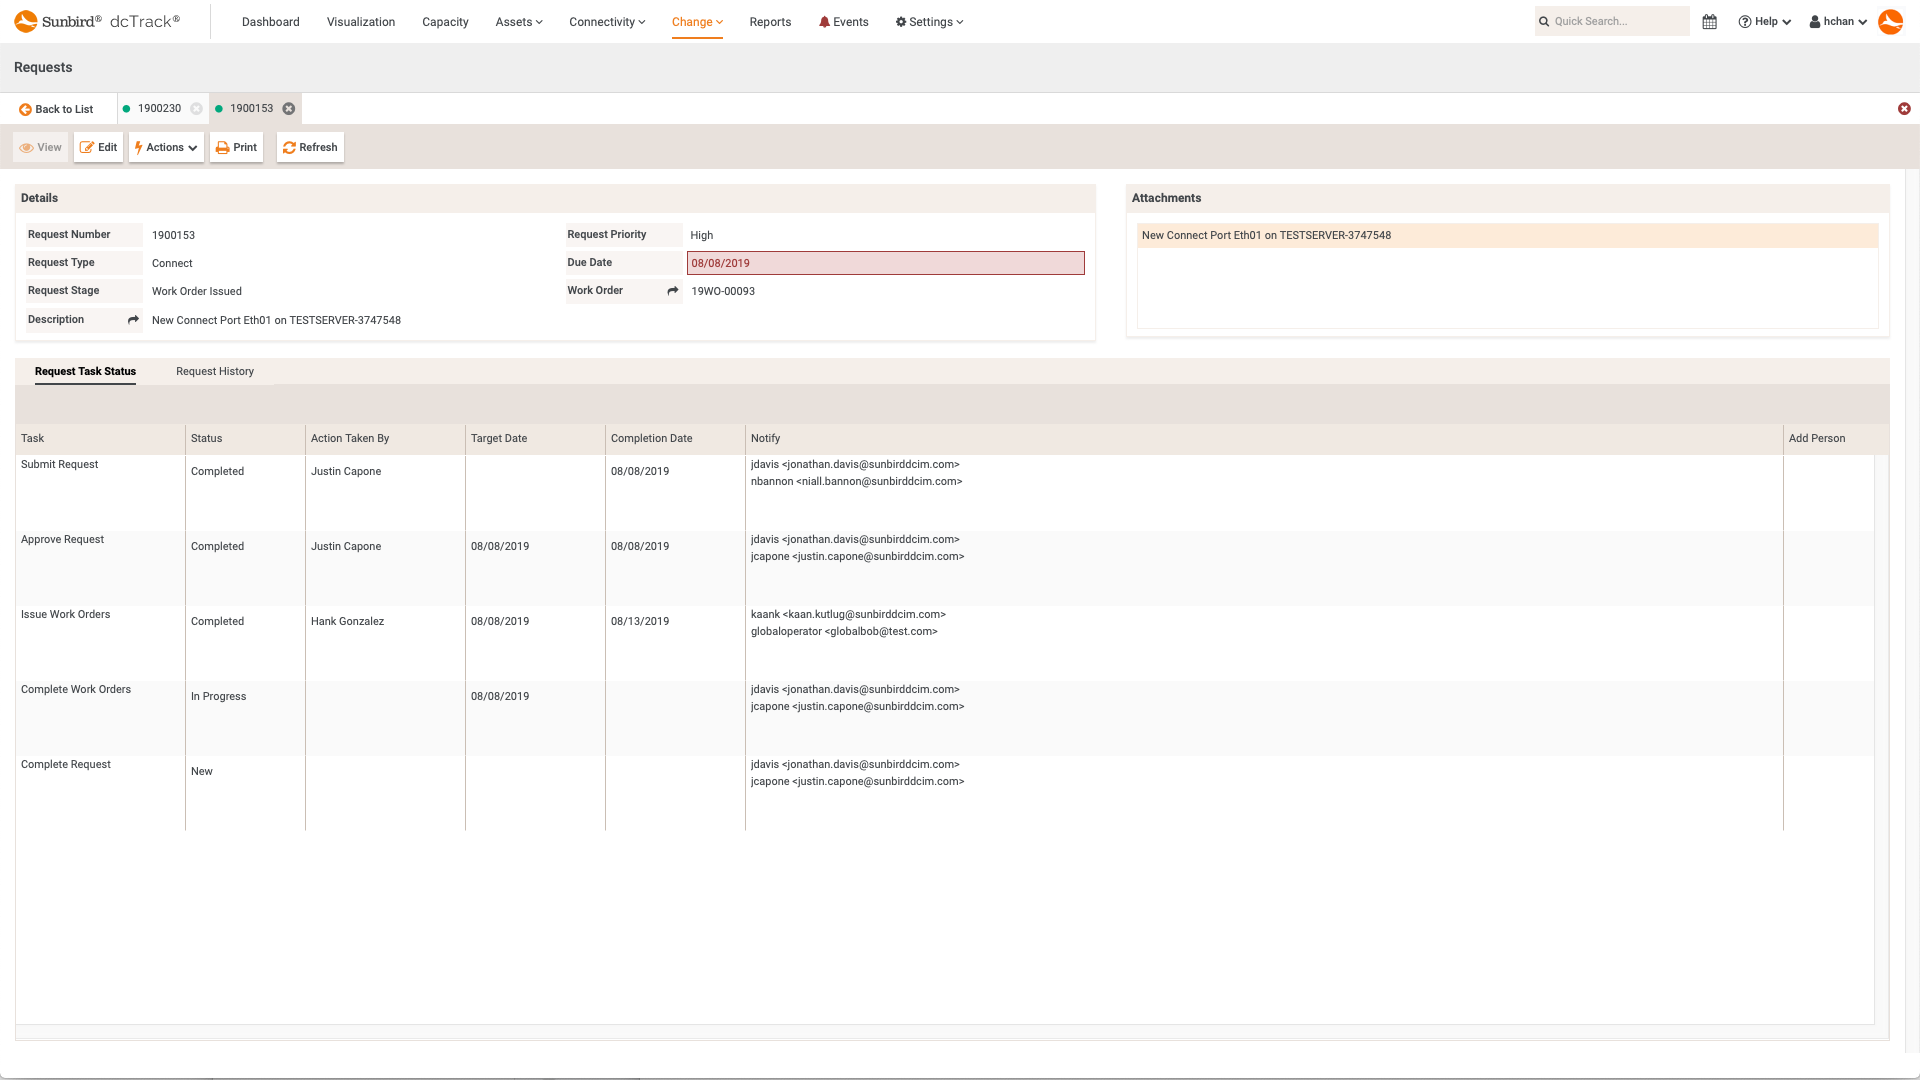
 dcTrack DCIM Operations | Change ManagementChange Request Details
 -
 dcTrack DCIM Operations | Connectivity Management | VisualizationCable Trays on the Data Center Floor Map
 -
 dcTrack DCIM Operations | Connectivity Management | Visualization3D View - What's Connected to What
 -
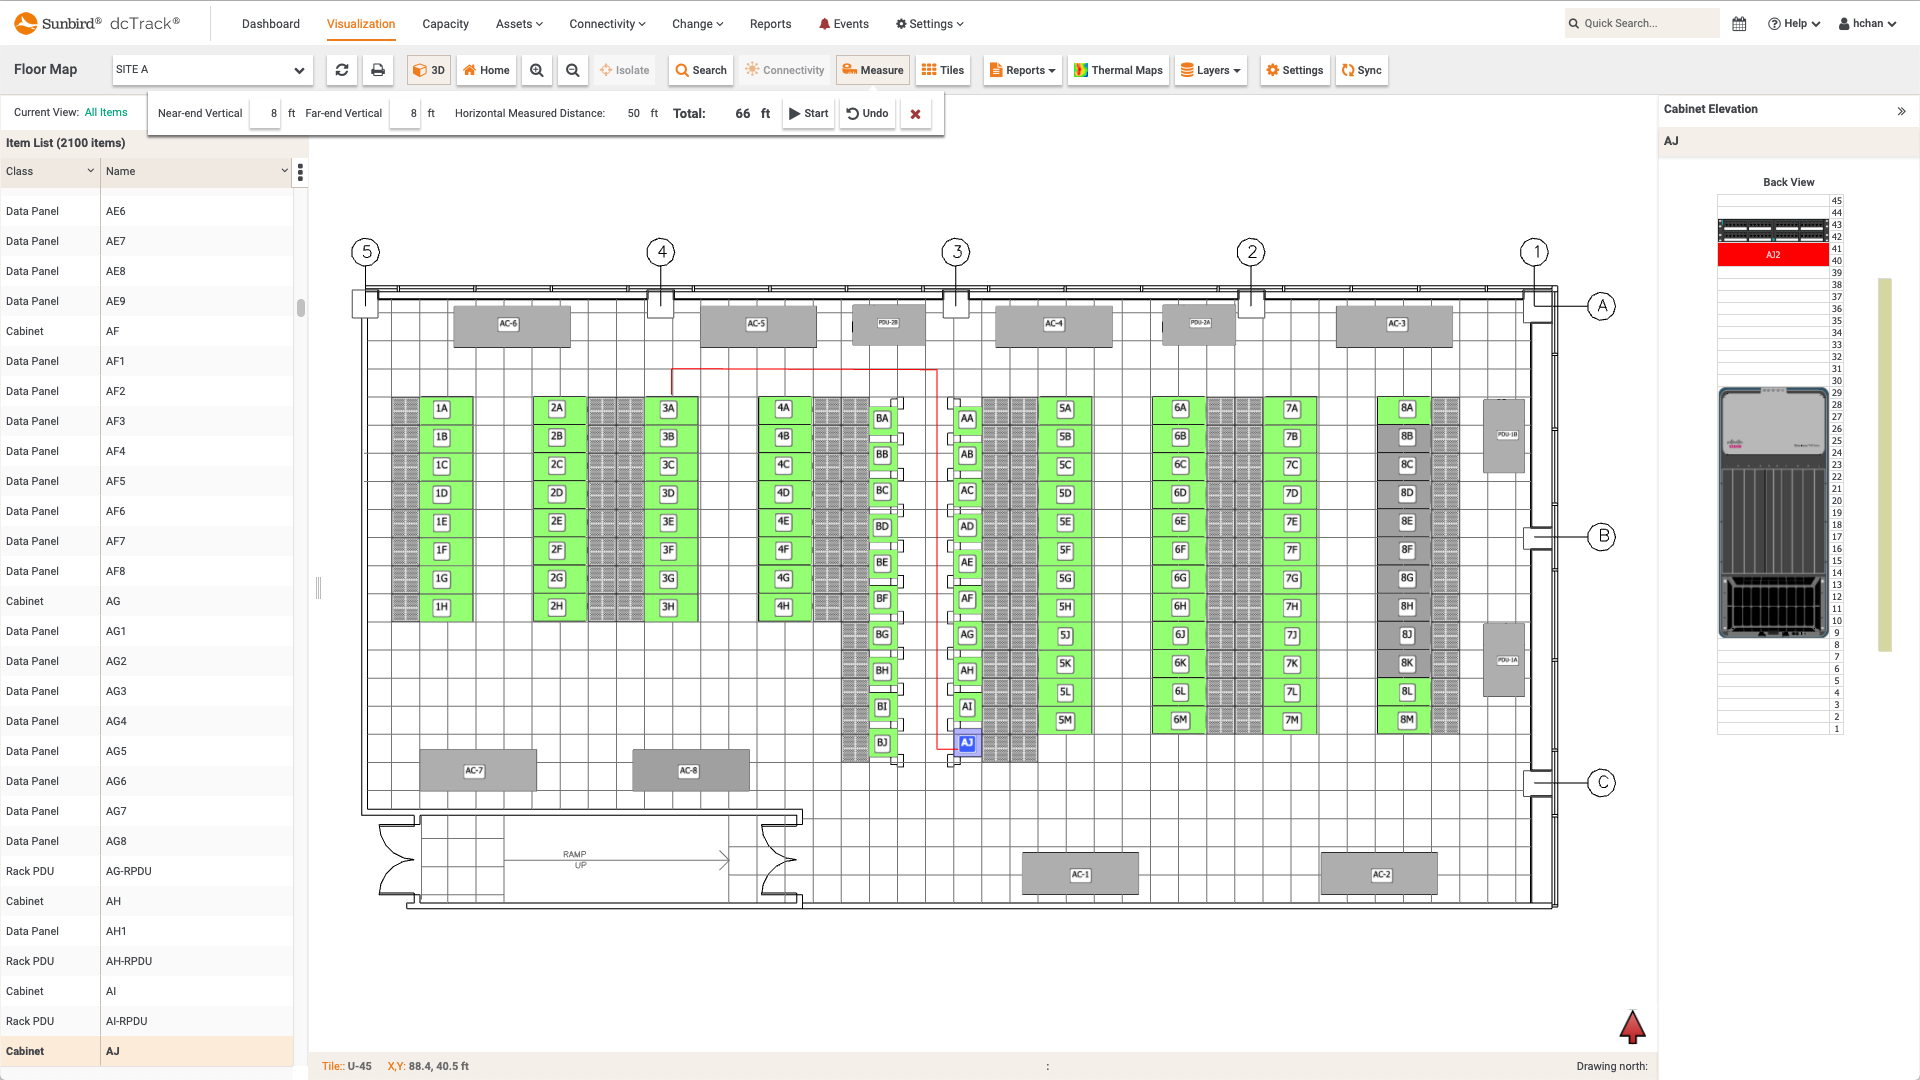
 dcTrack DCIM Operations | Connectivity Management | VisualizationCable Measurements on the Data Center Floor Map
 -
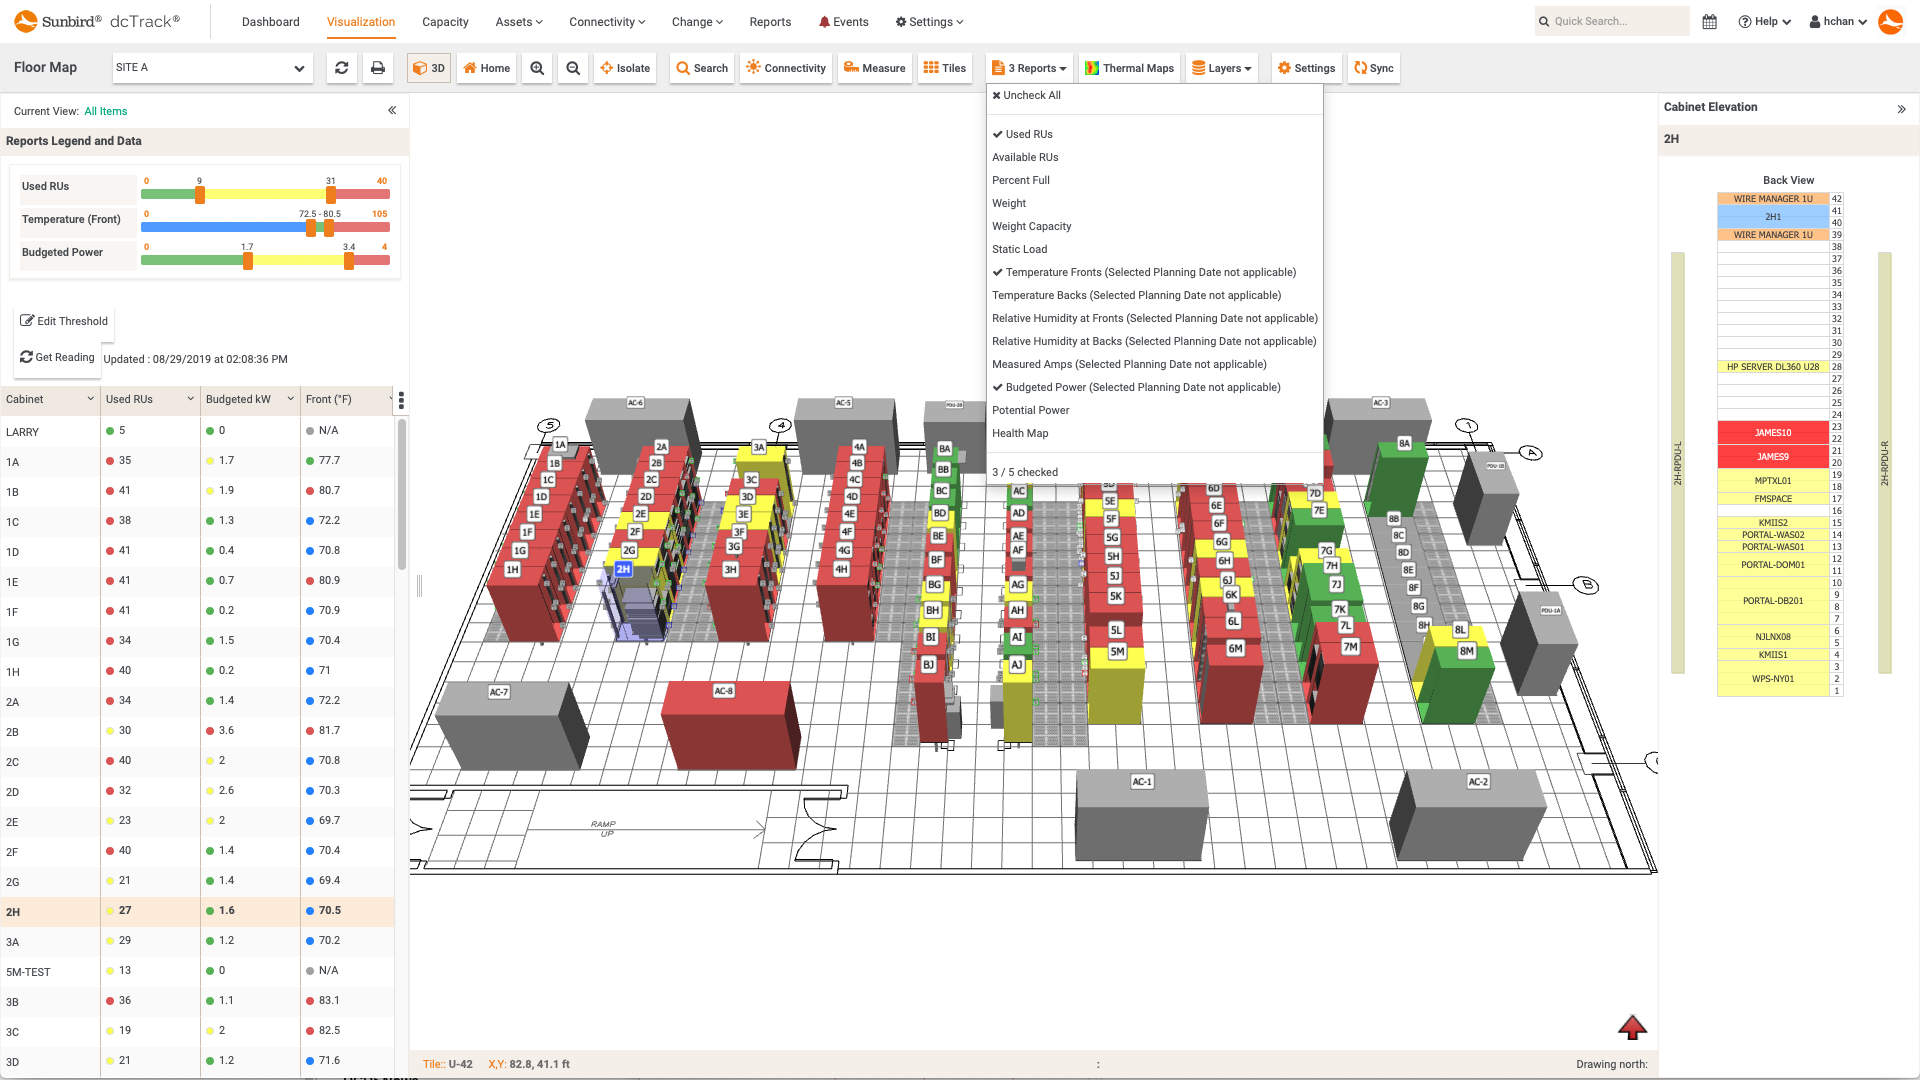
 dcTrack DCIM Operations | Visualization | BI & Data AnalyticsMultiple Floor Map Reports
 -
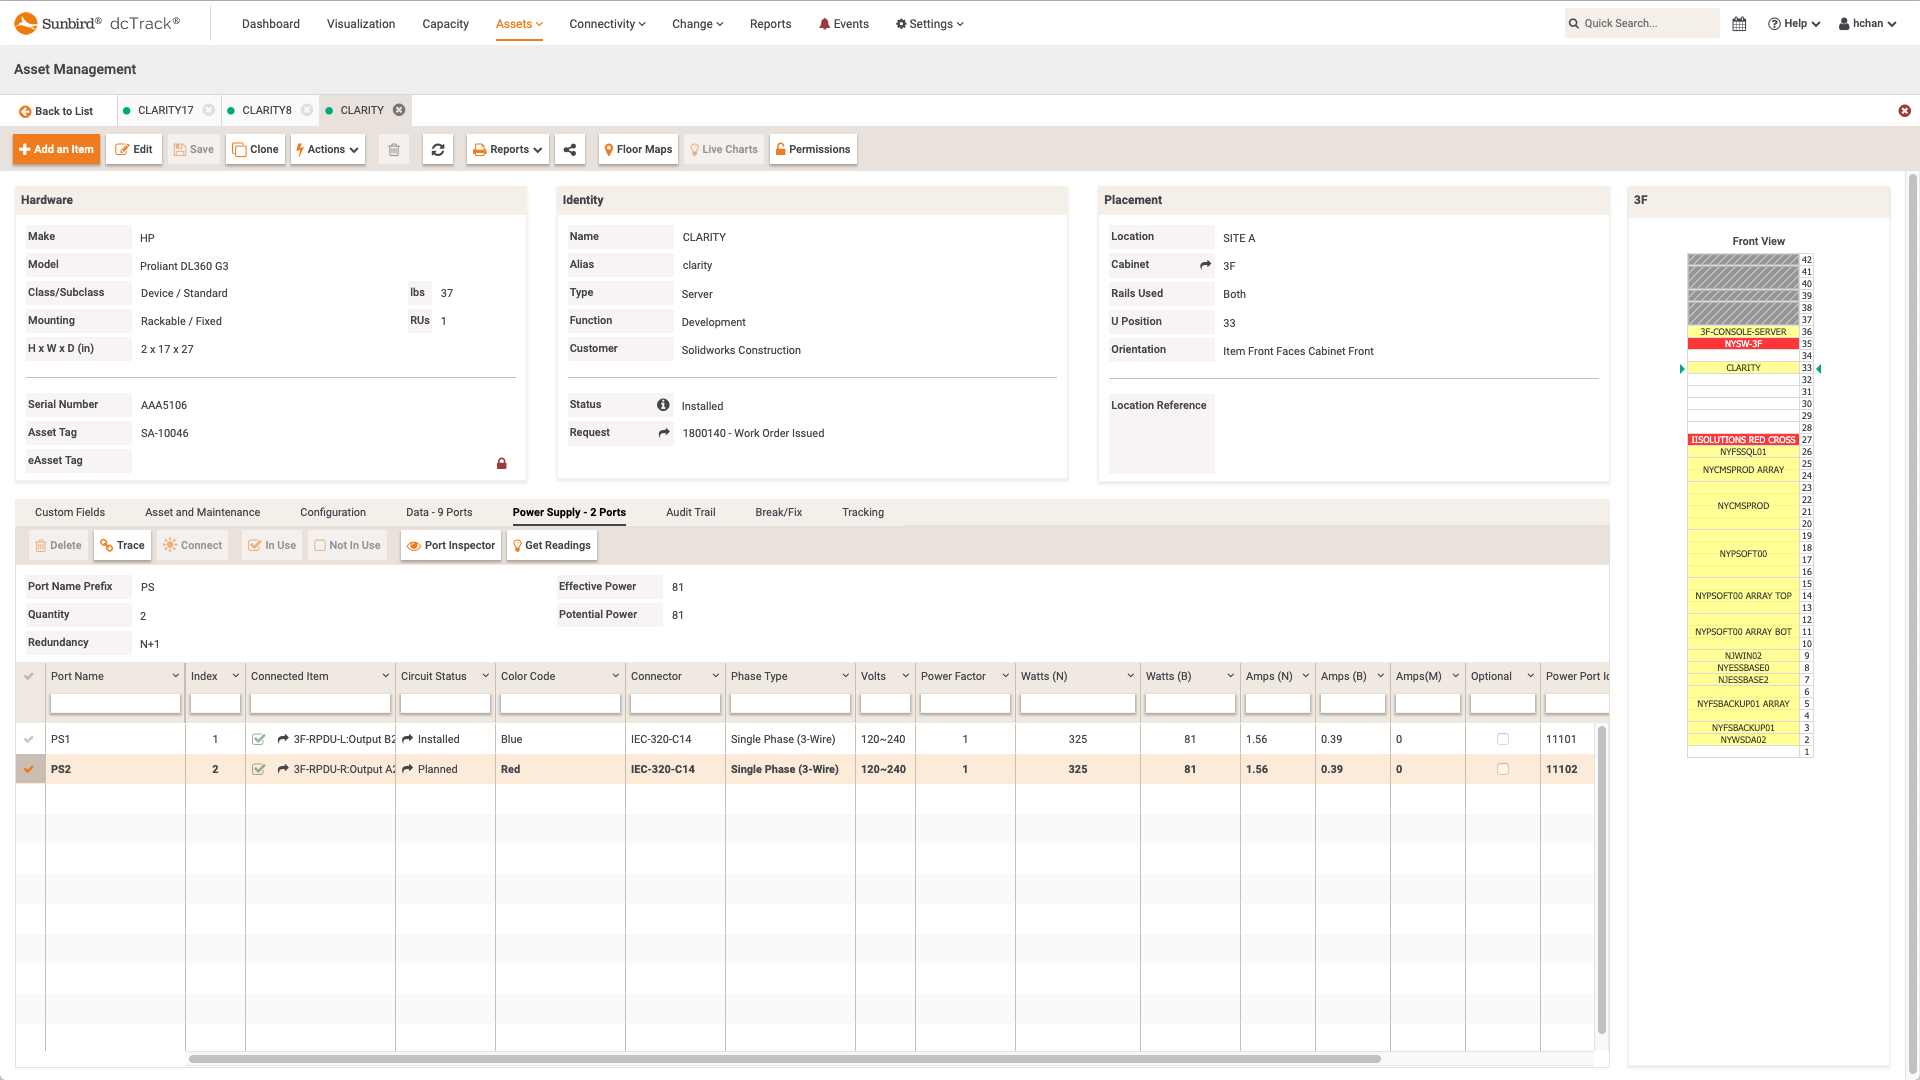
 dcTrack DCIM Operations | Asset Management | Power Management | Connectivity ManagementPower Ports Displayed in Asset Details
 -
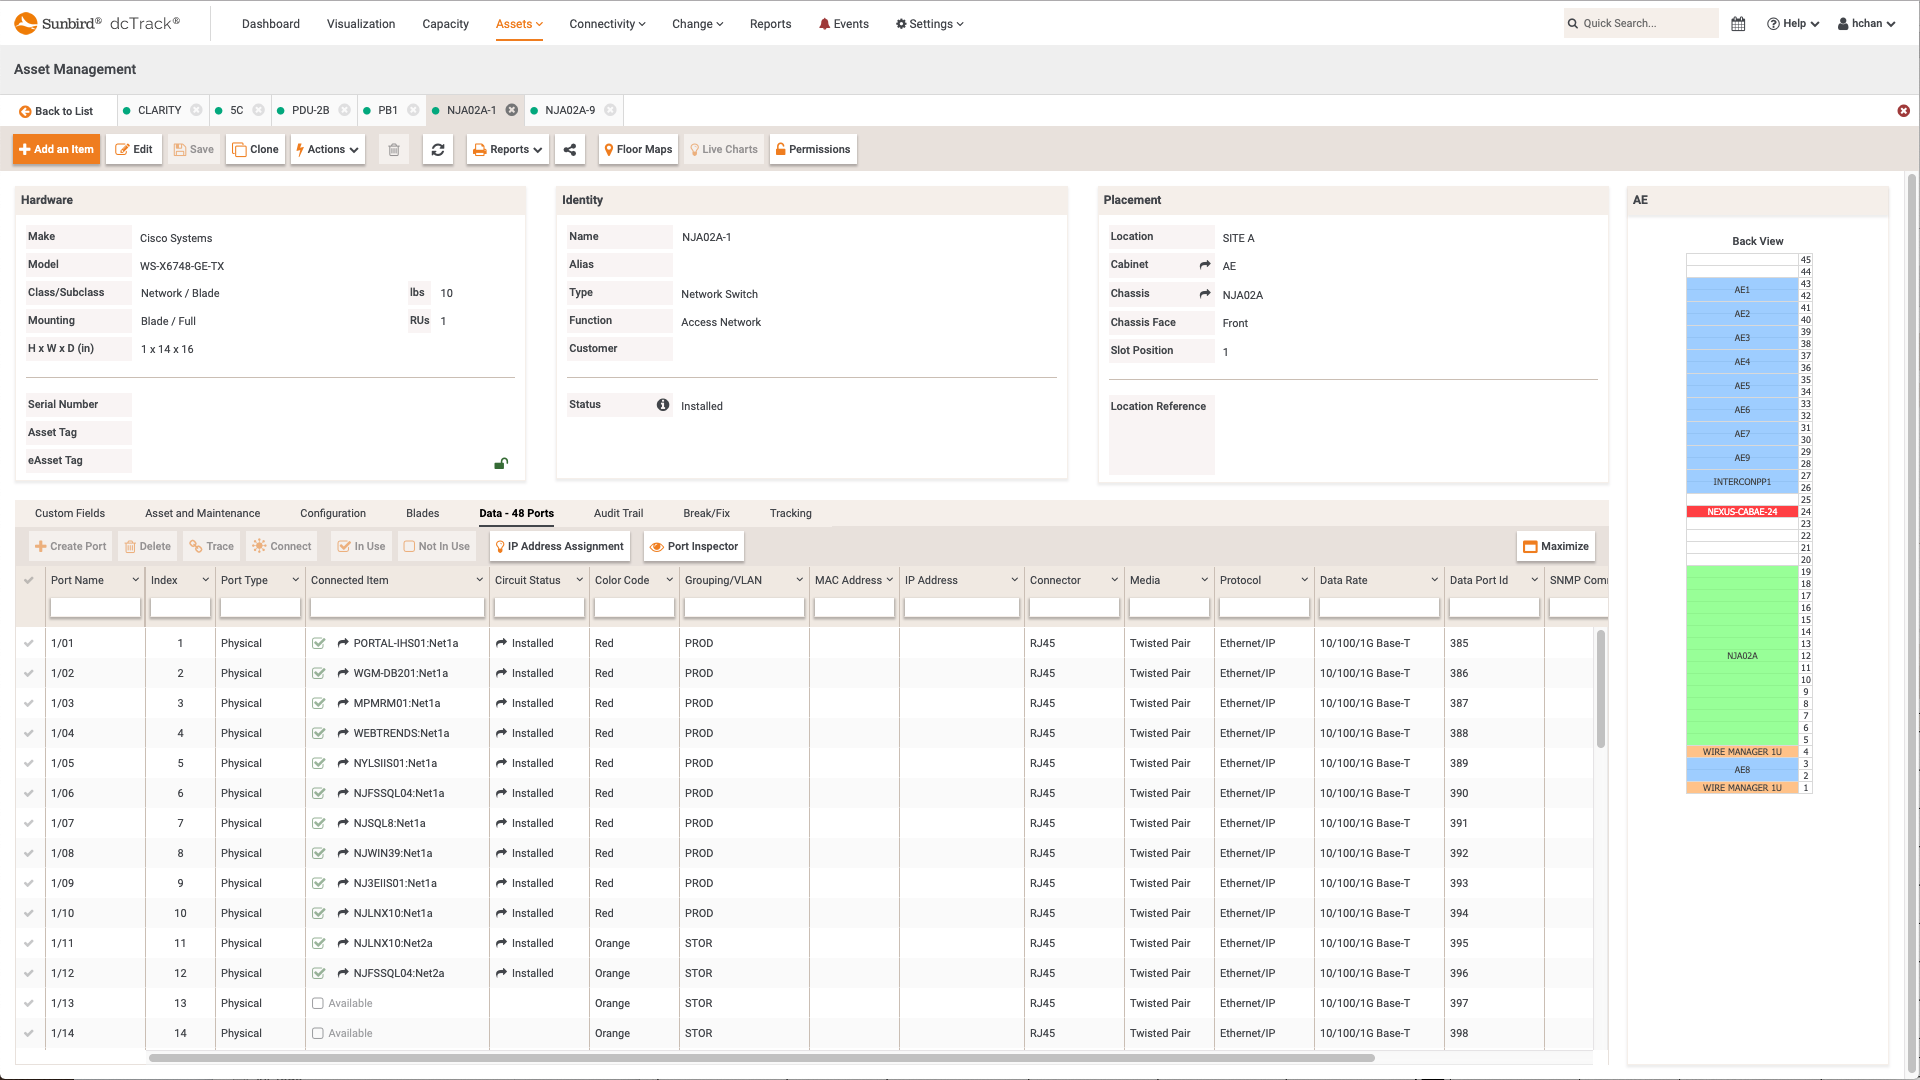
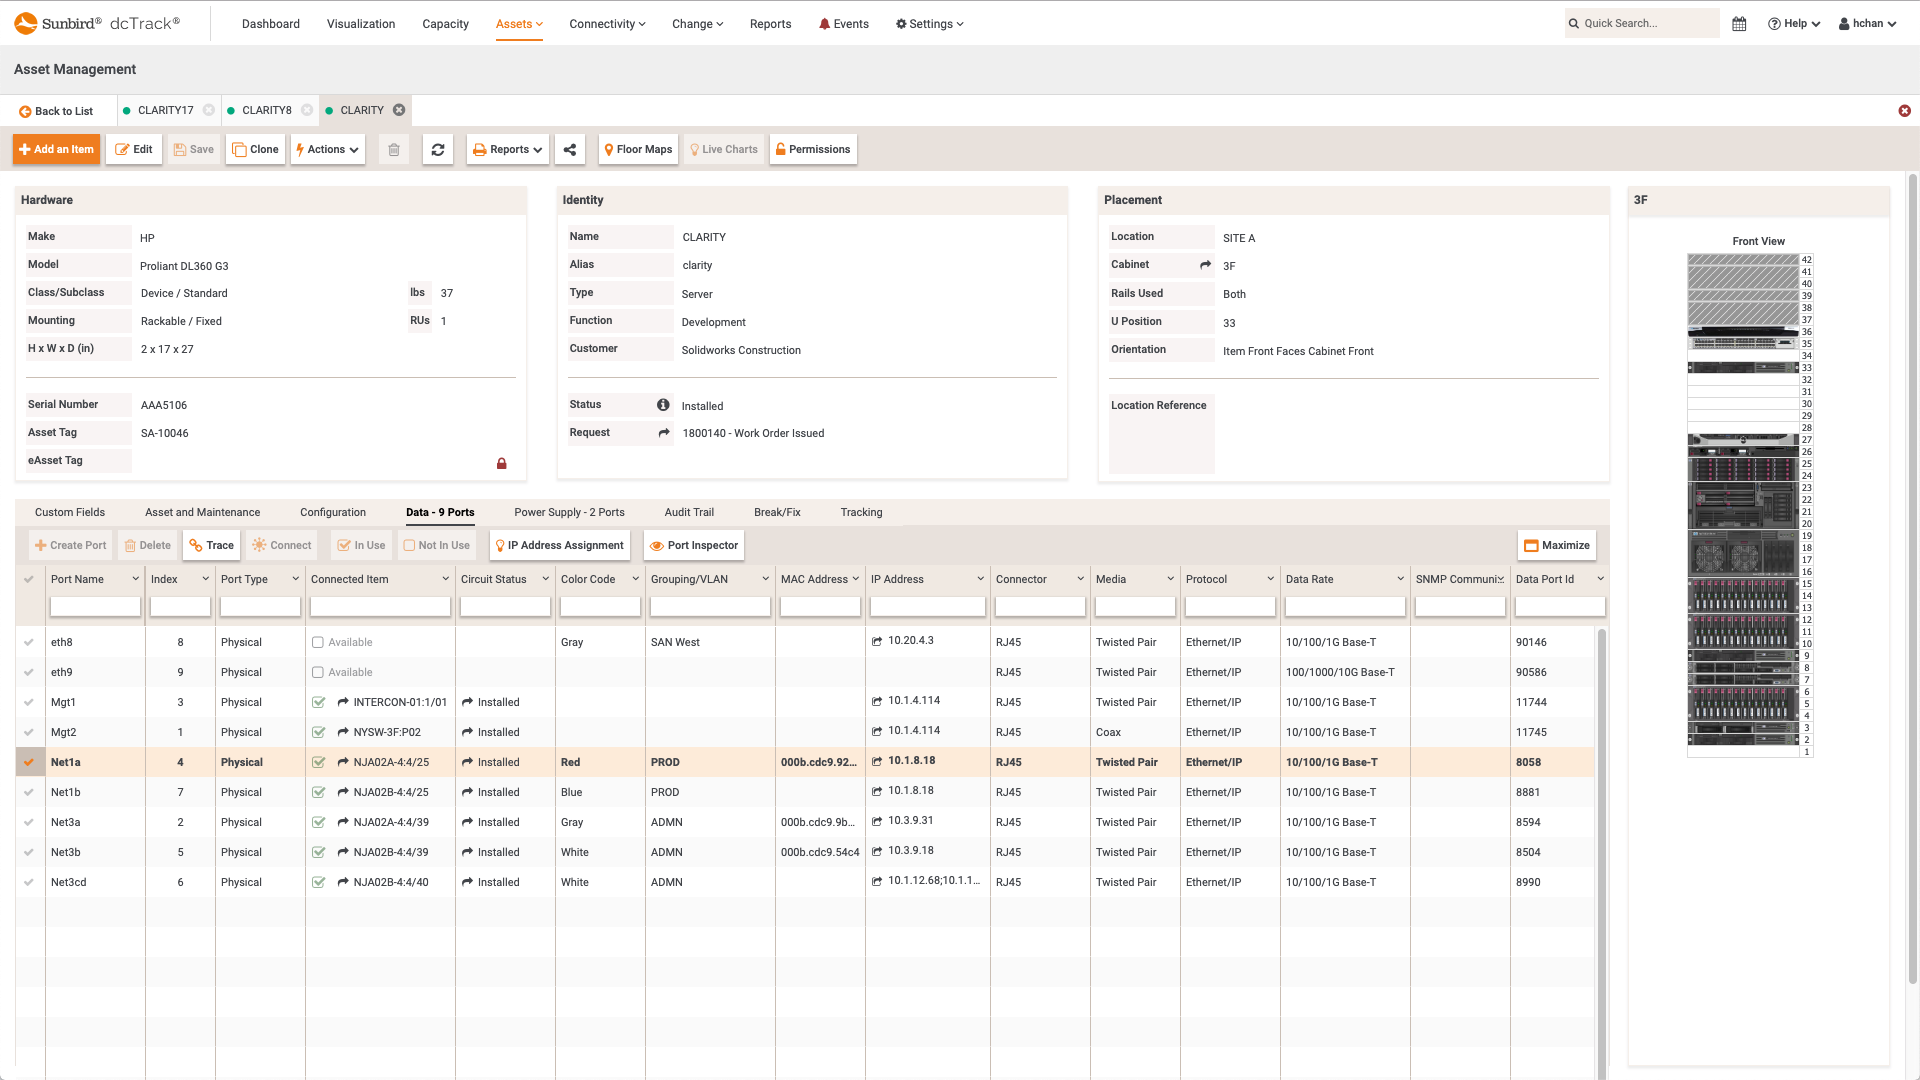
 dcTrack DCIM Operations | Asset Management | Connectivity ManagementData Ports Displayed in Asset Details
 -
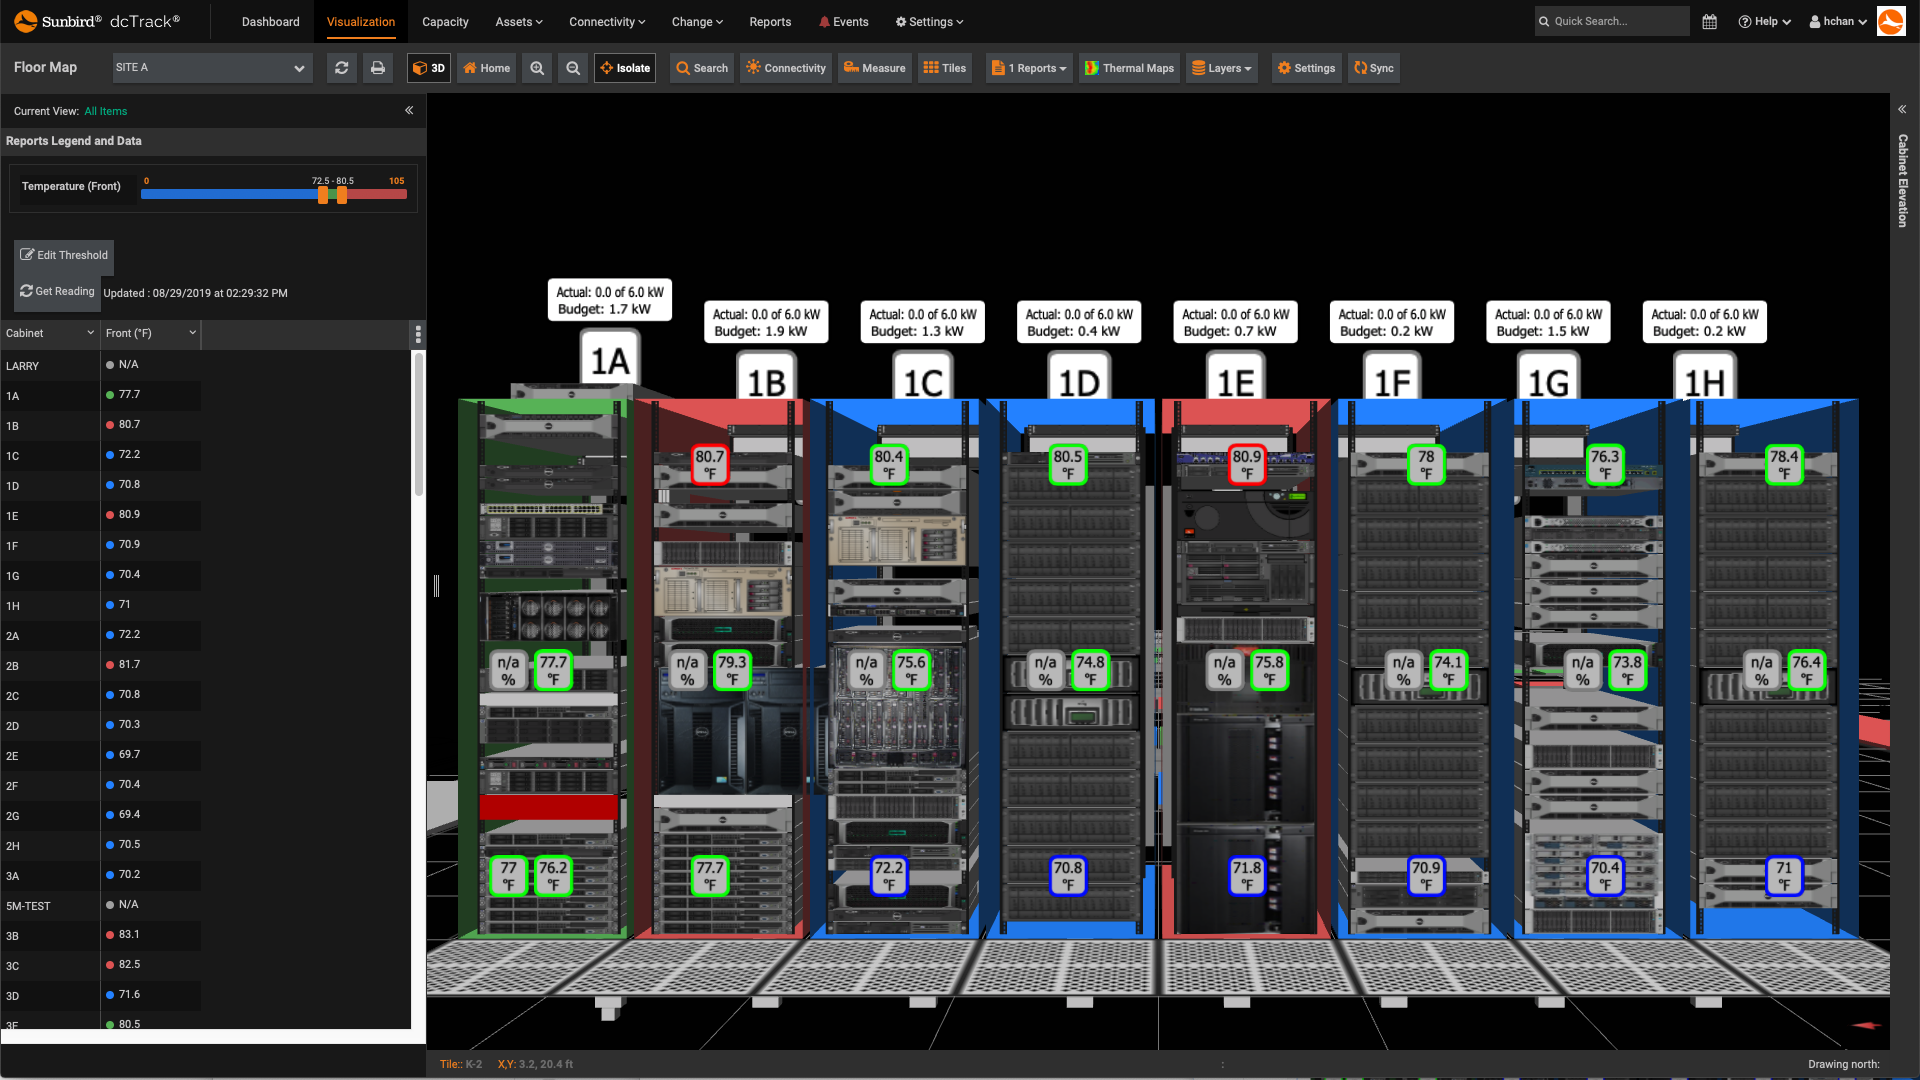
 dcTrack DCIM Operations | Environment Management | VisualizationIsolated Cabinet View with Environmental Reporting
 -
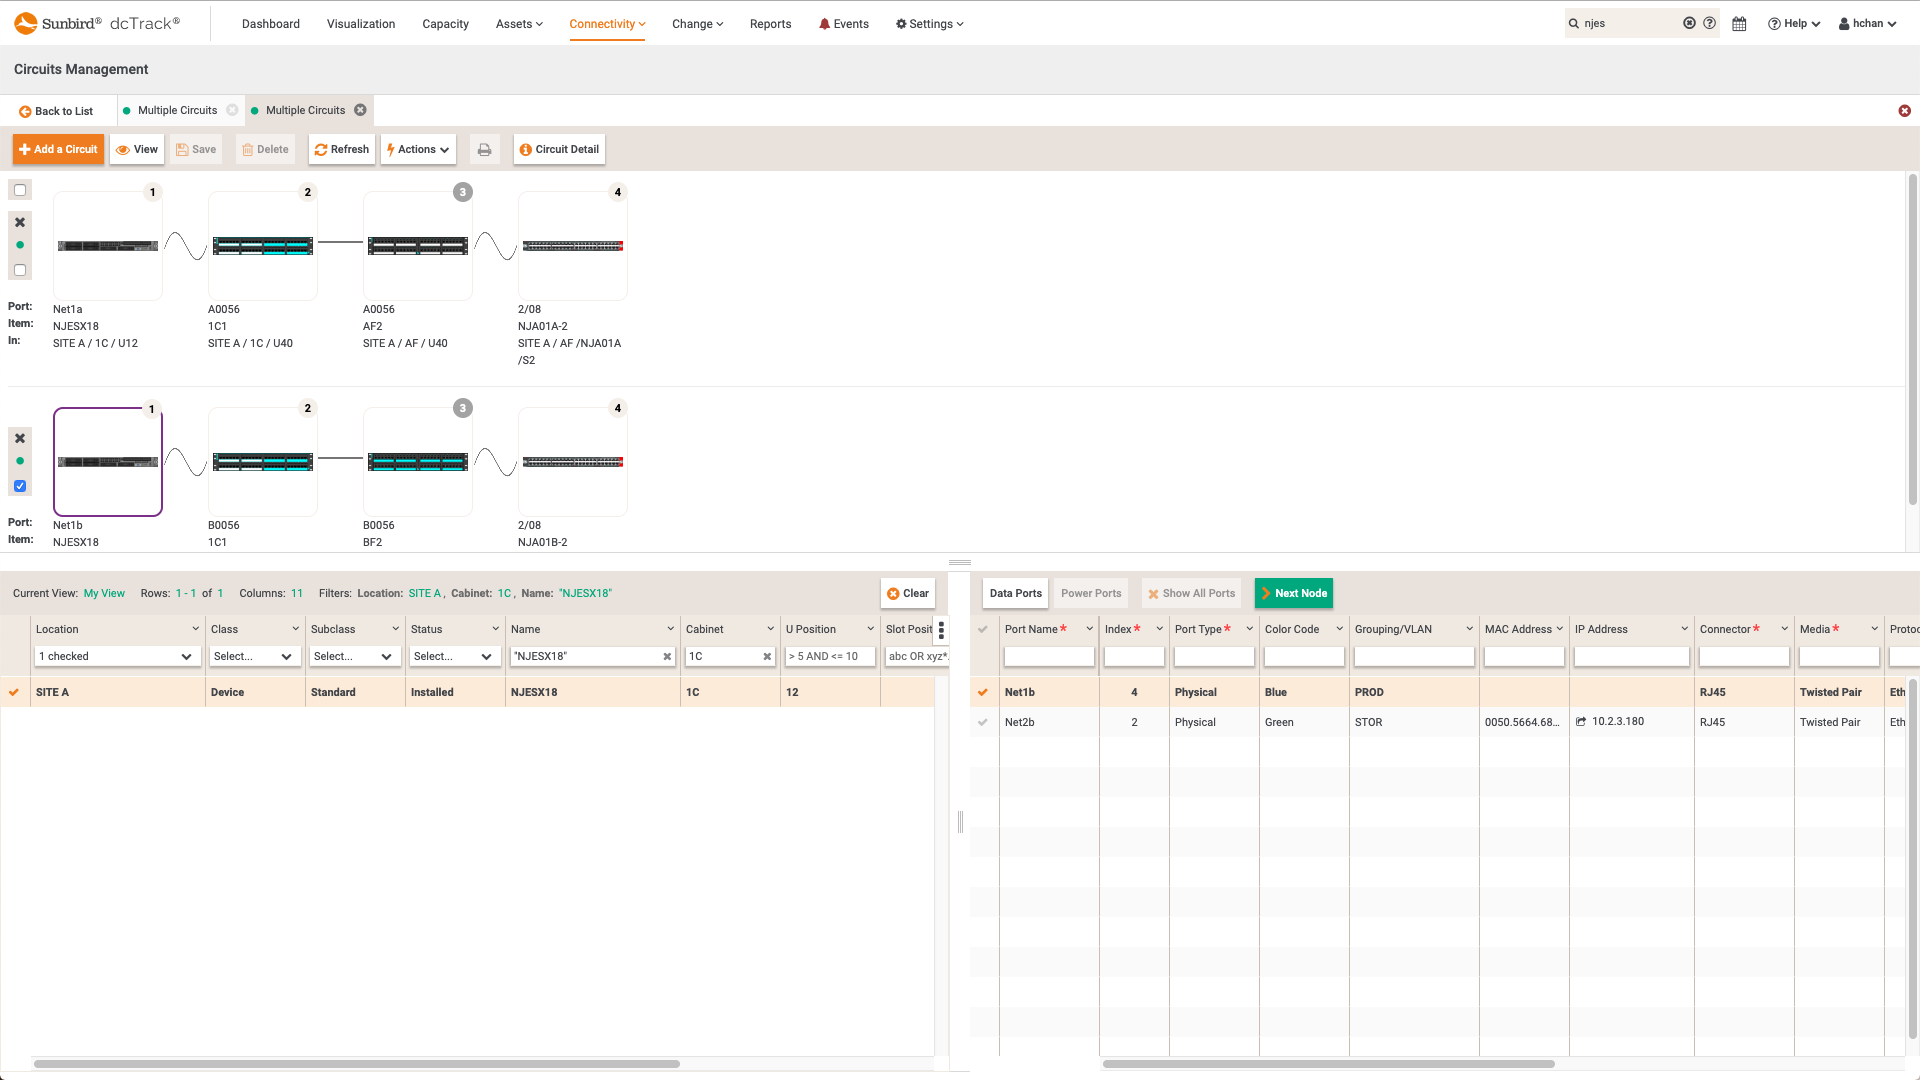
 dcTrack DCIM Operations | Connectivity Management | Capacity Management | Power Management | VisualizationMultiple Data Circuit Traces from Redundant NICs
 -
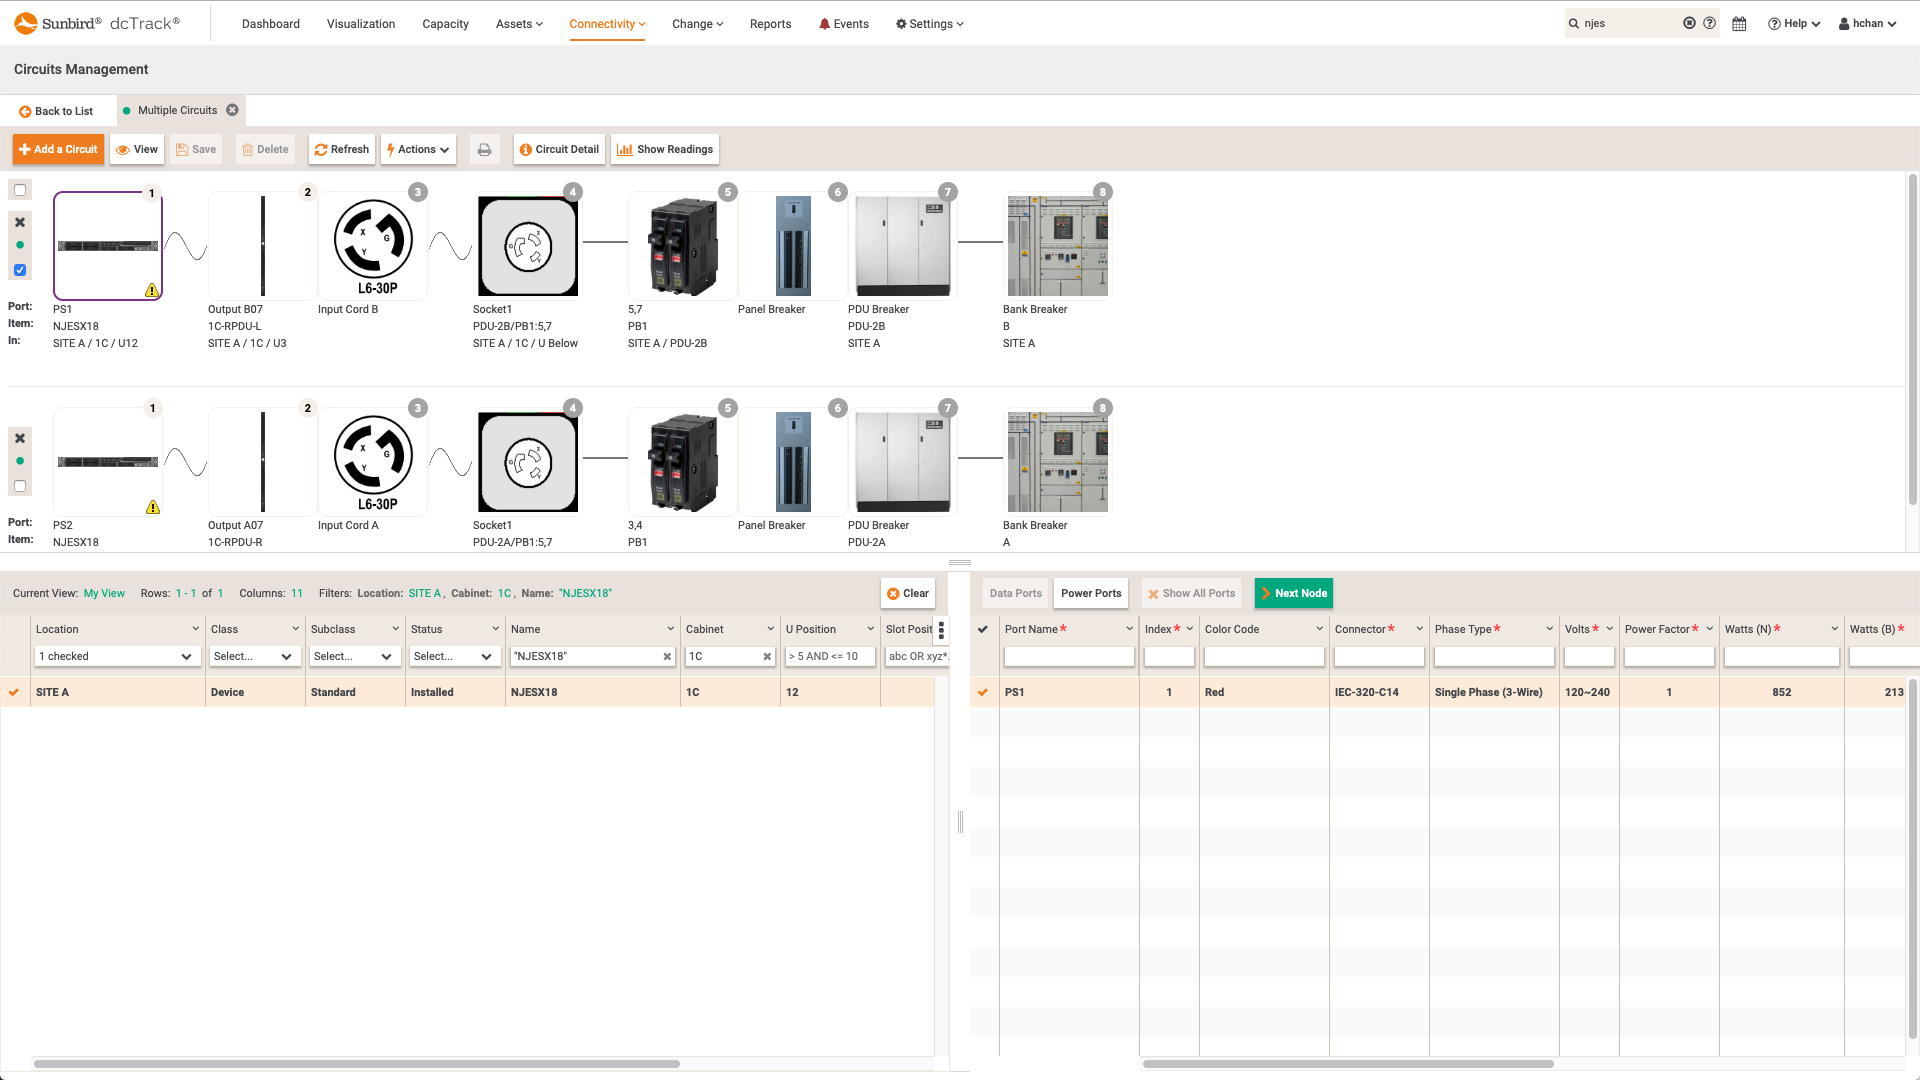
 dcTrack DCIM Operations | Connectivity Management | Capacity Management | Power Management | VisualizationMultiple Power Circuit Trace from Redundant Power Supplies
 -
 dcTrack DCIM Operations | BI & Data Analytics | Visualization | Environment ManagementHorizontal Thermal Time-Lapse Video
 -
 dcTrack DCIM Operations | BI & Data Analytics | VisualizationIsolated Cabinet View with Multiple Reports
 -
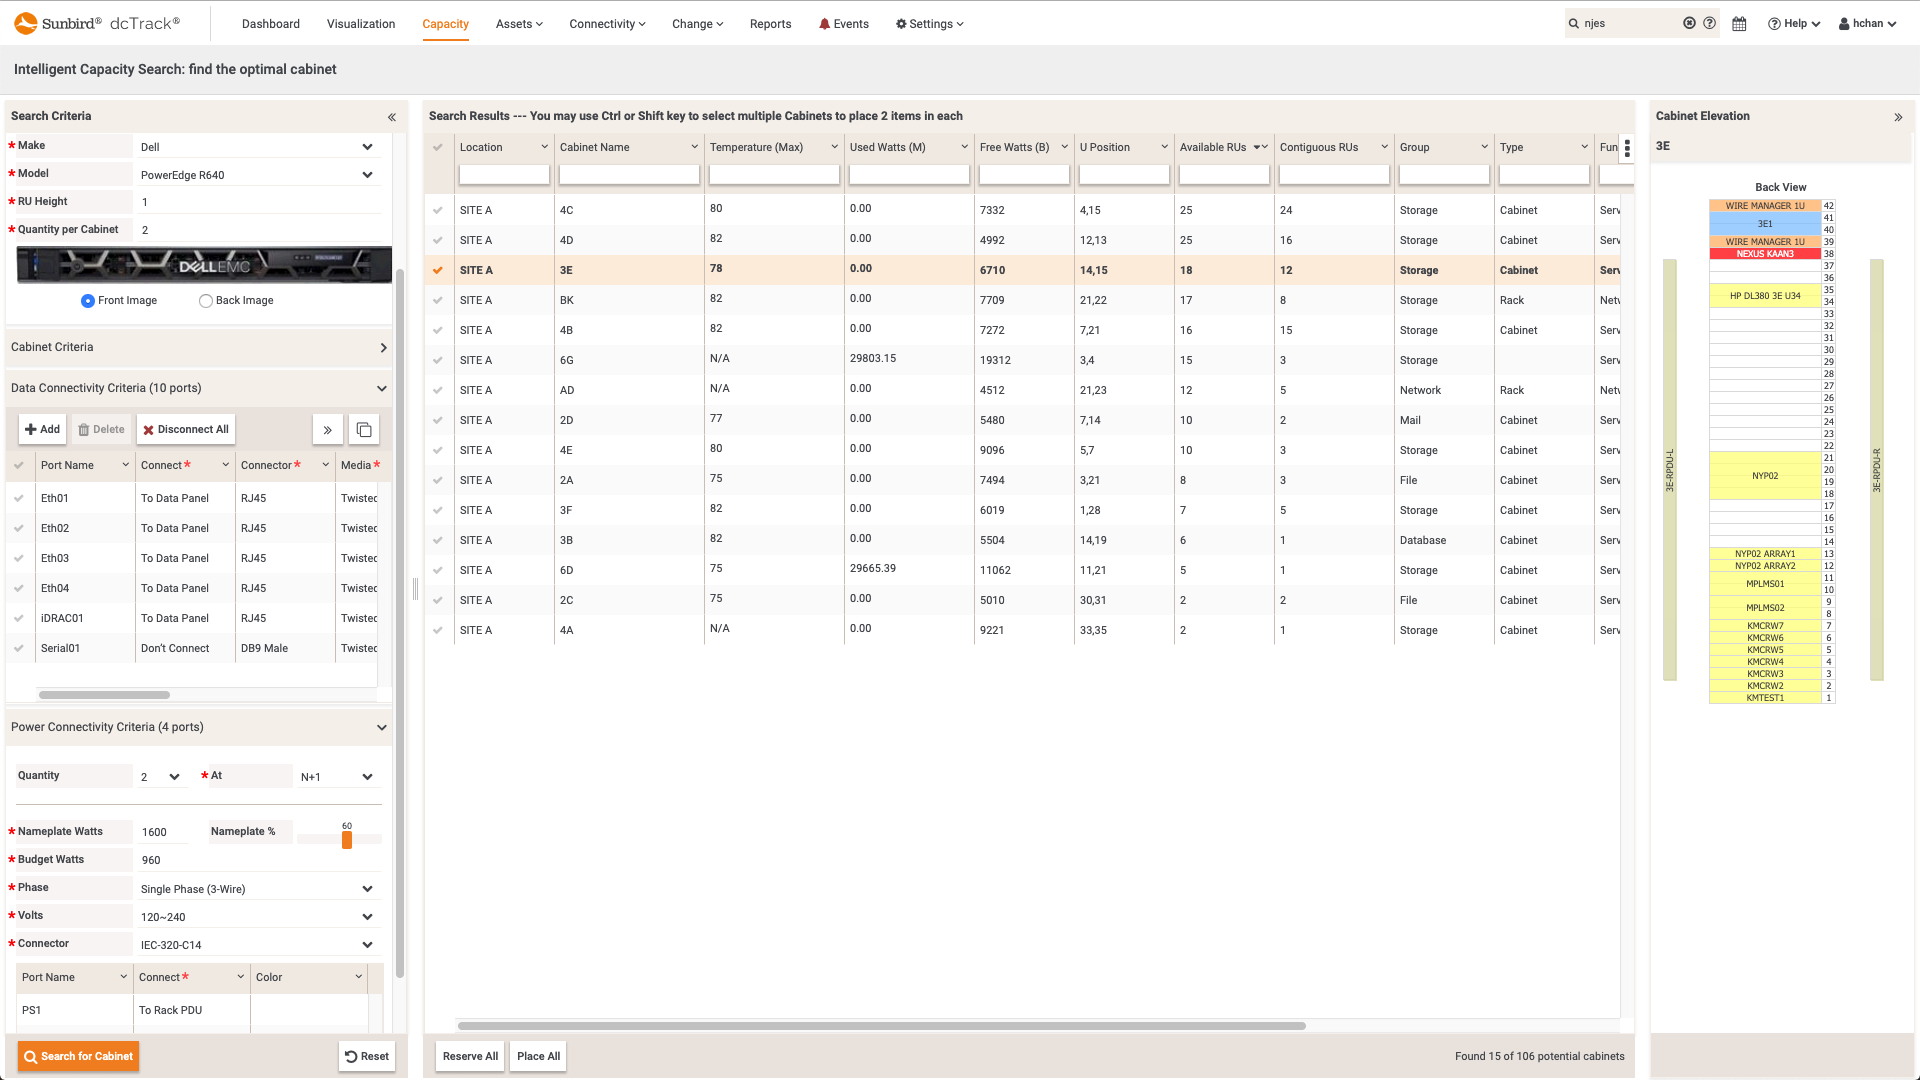
 dcTrack DCIM Operations | Capacity ManagementIntelligent Capacity Search for Space, Power, and Data Connectivity
 -
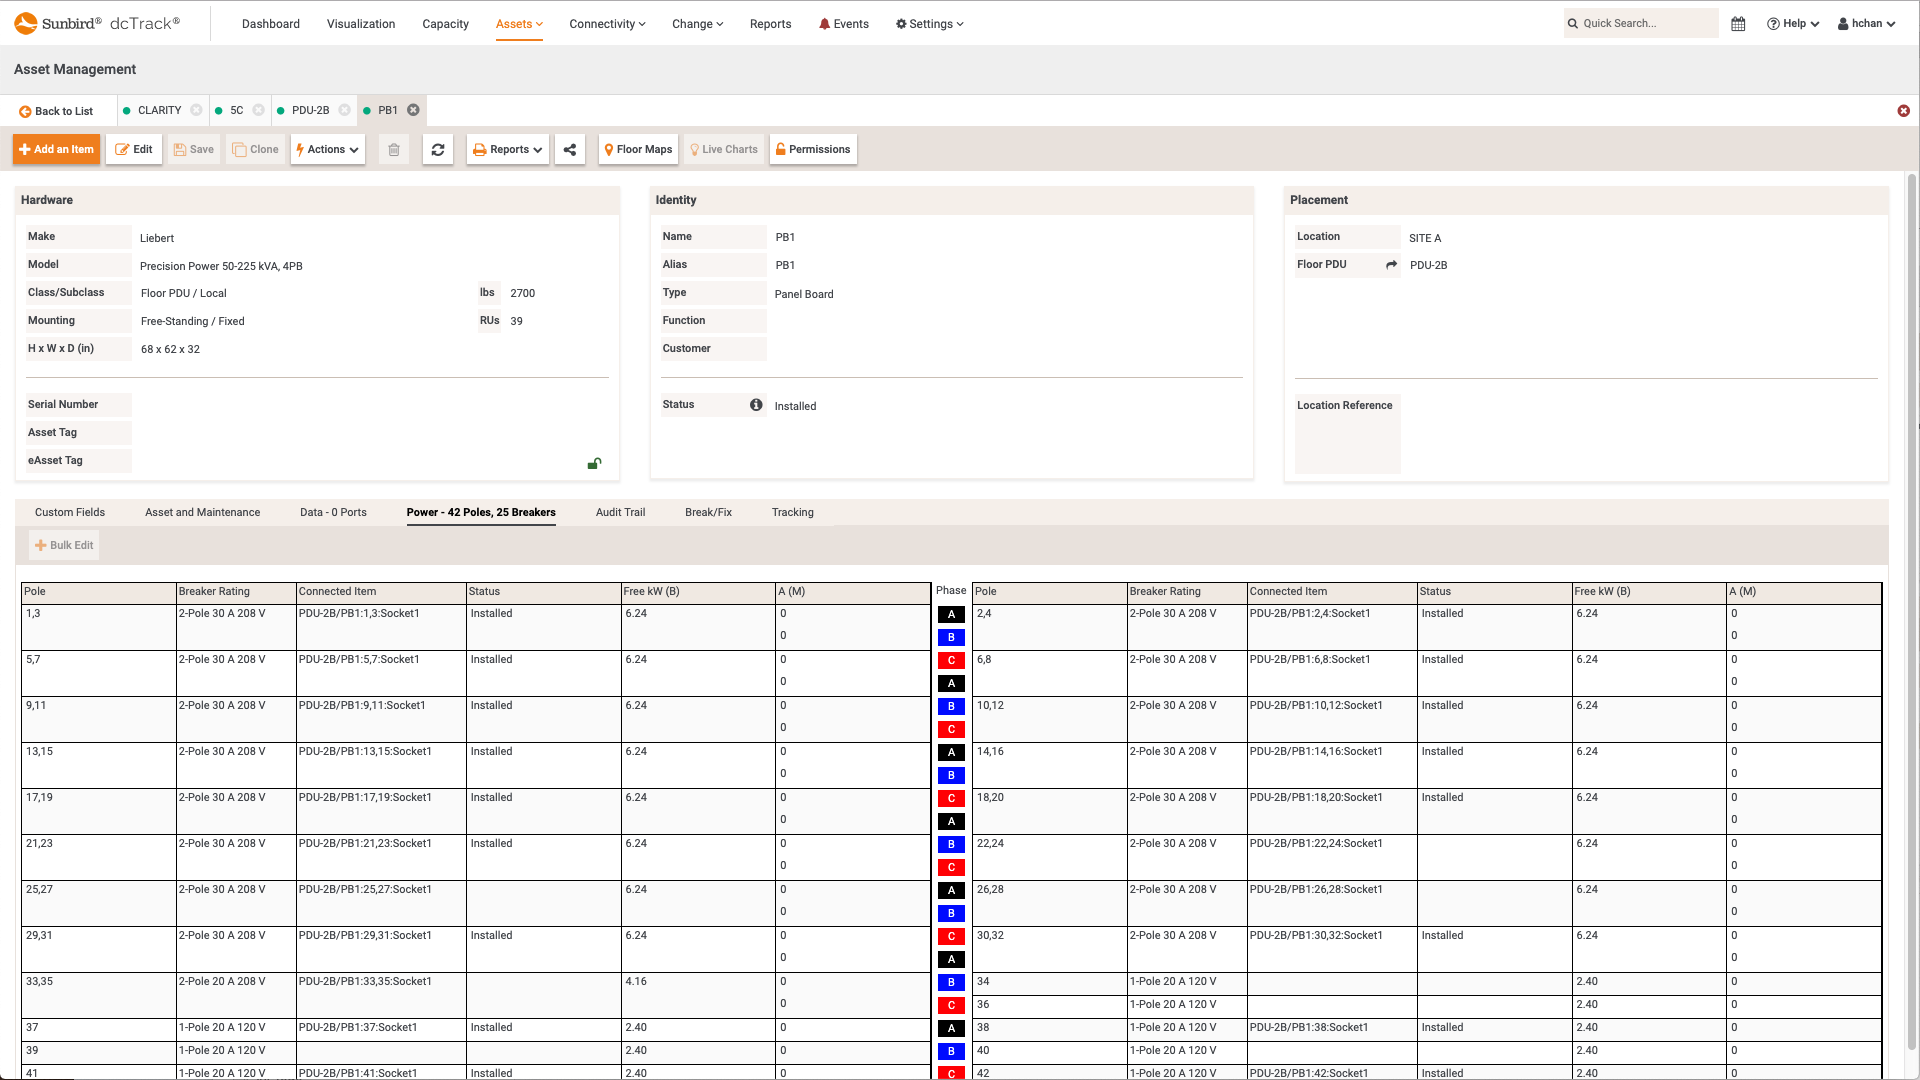
 dcTrack DCIM Operations | Asset ManagementFloor PDU Panel Details with Panel Schedule
 -
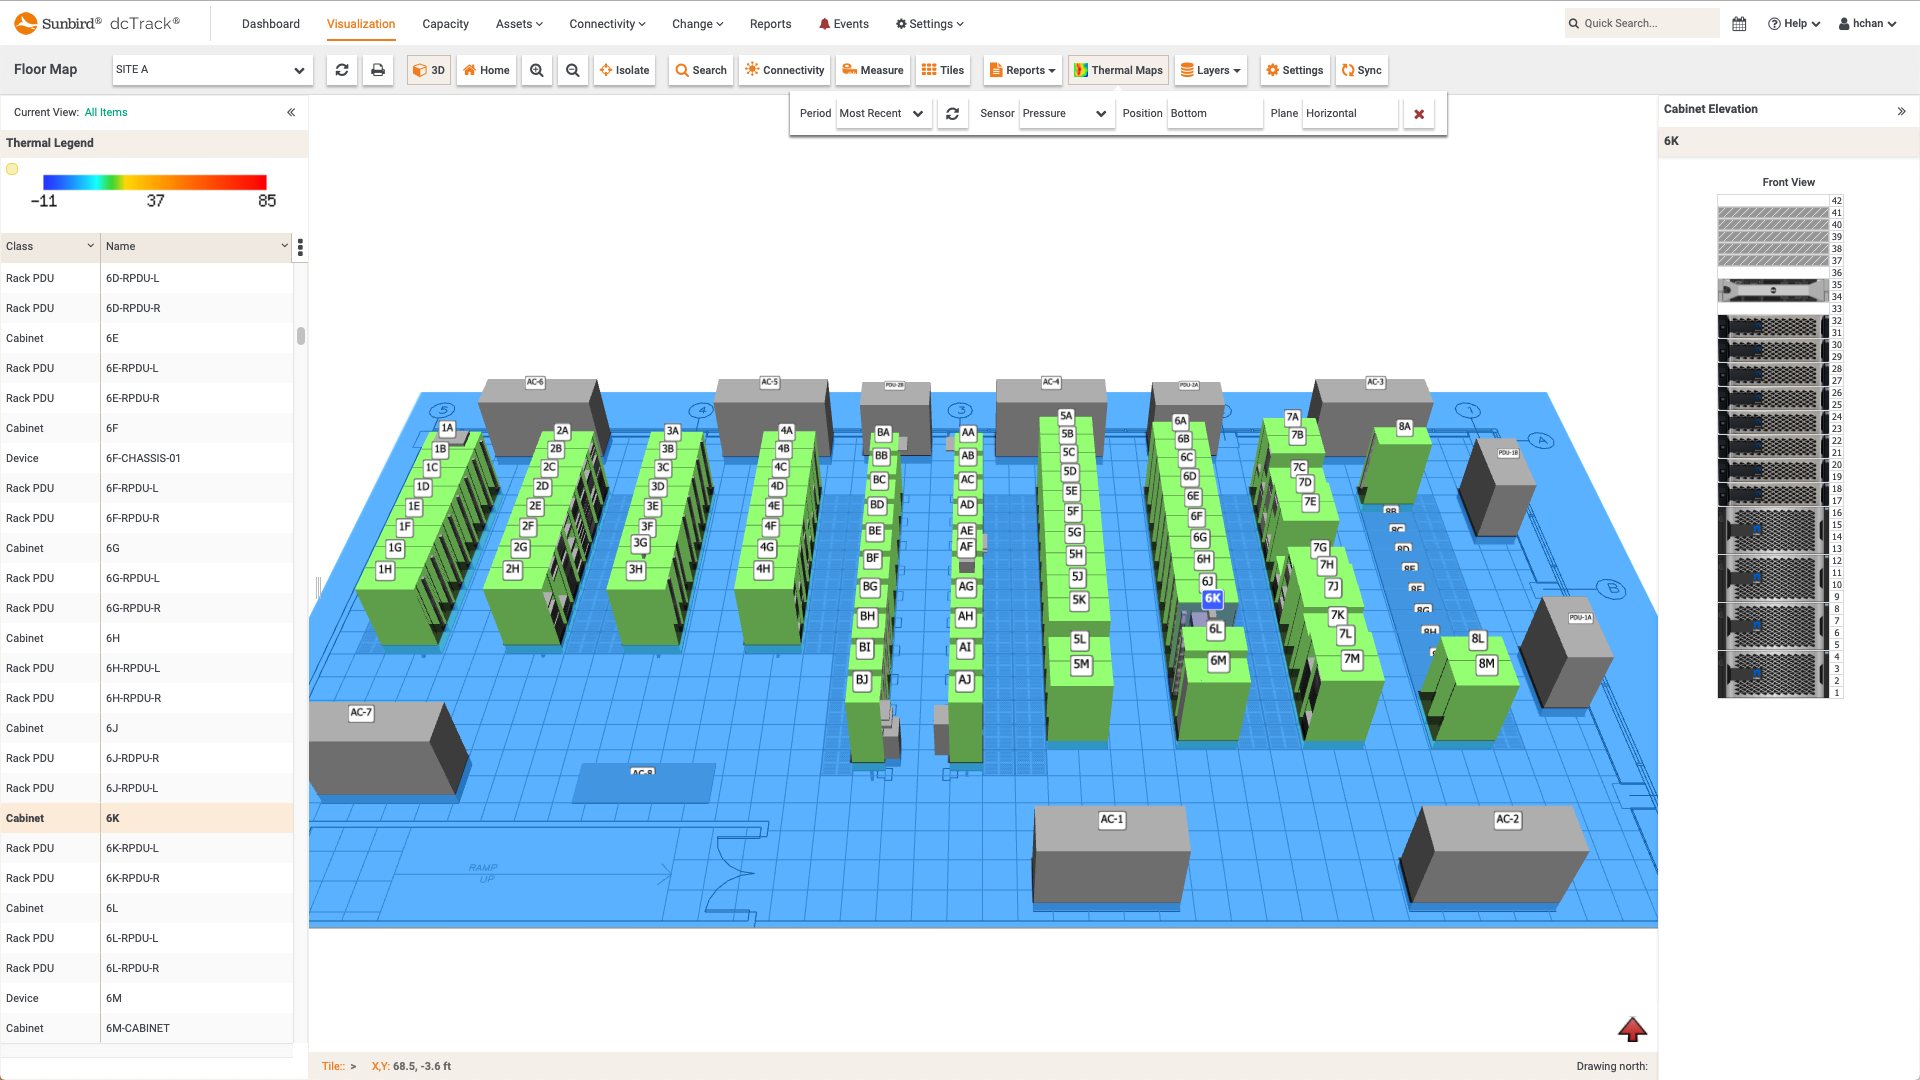
 dcTrack DCIM Operations | Environment Management | BI & Data Analytics | VisualizationPressure Map Time Lapse Video
 -
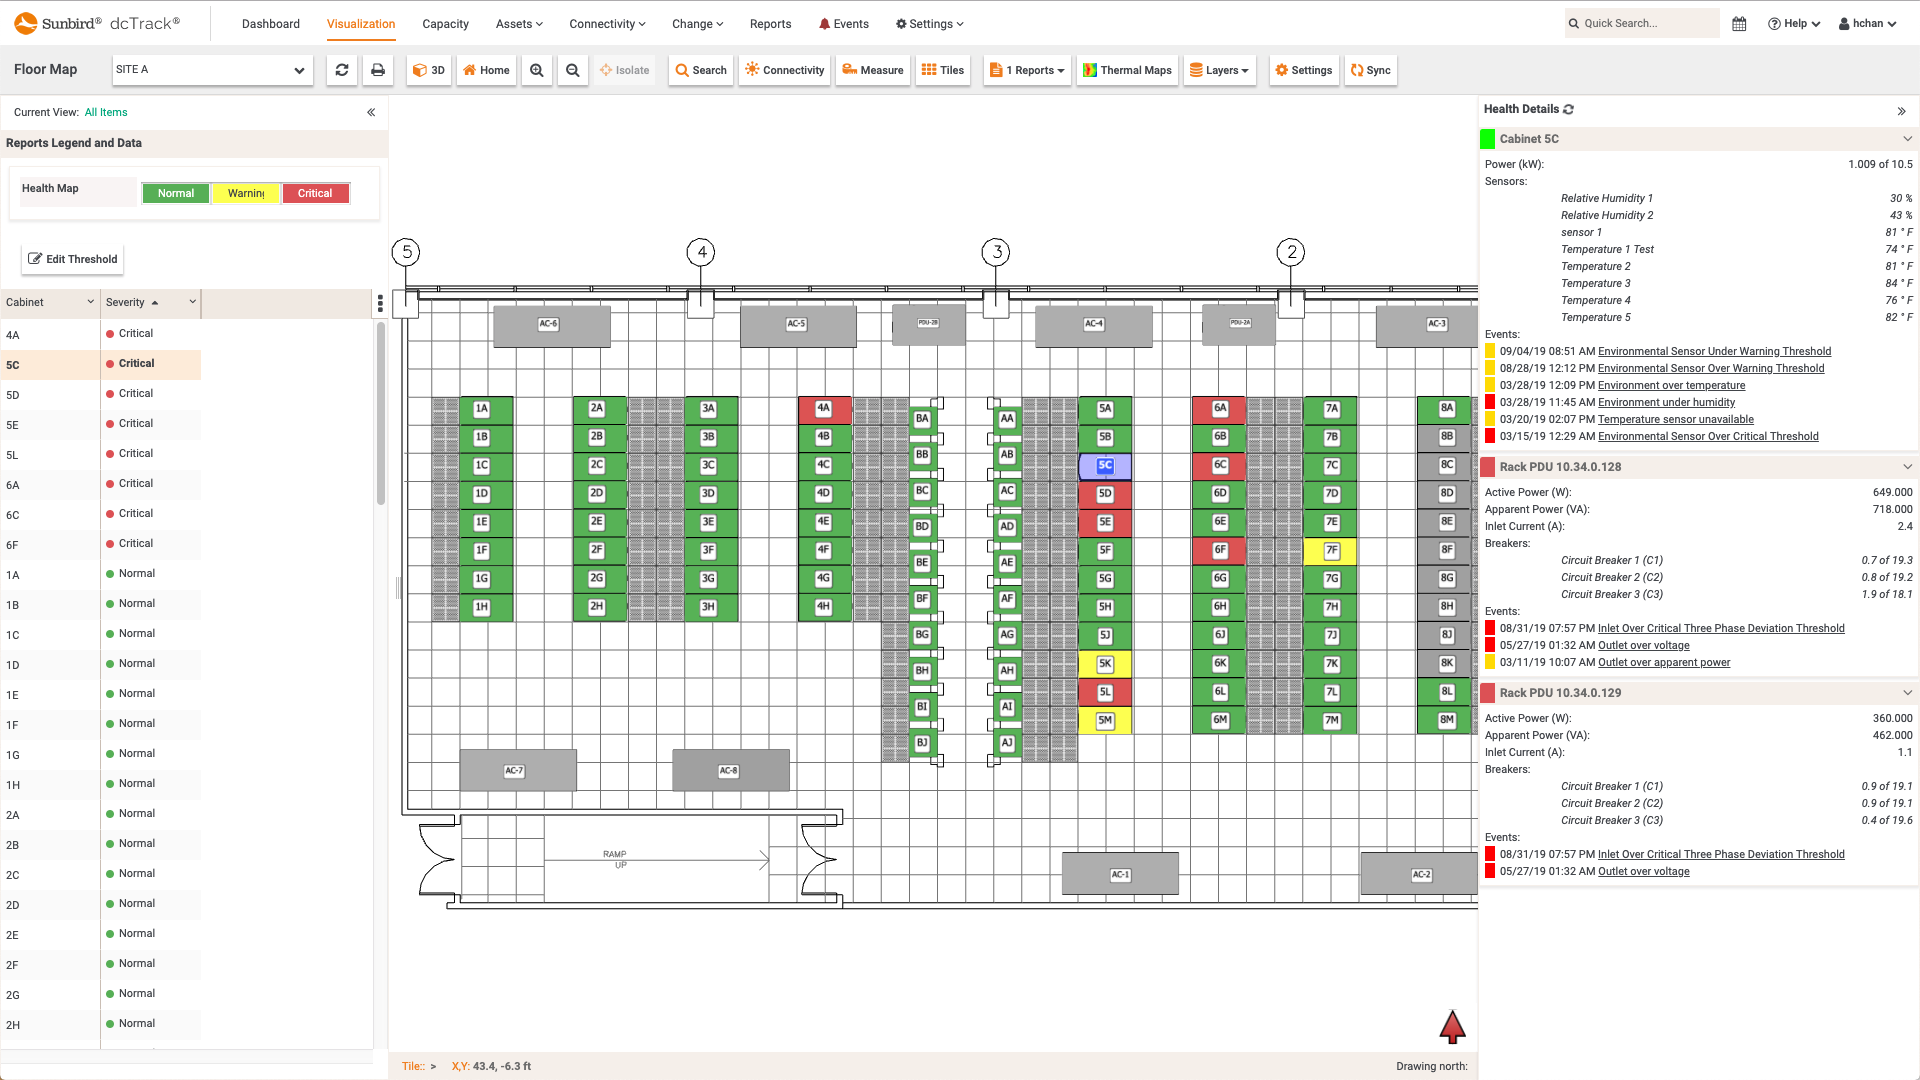
 dcTrack DCIM Operations | Power Management | Environment Management | Capacity Management | BI & Data Analytics | VisualizationdcTrack Cabinet Health Floor Map Report
 -
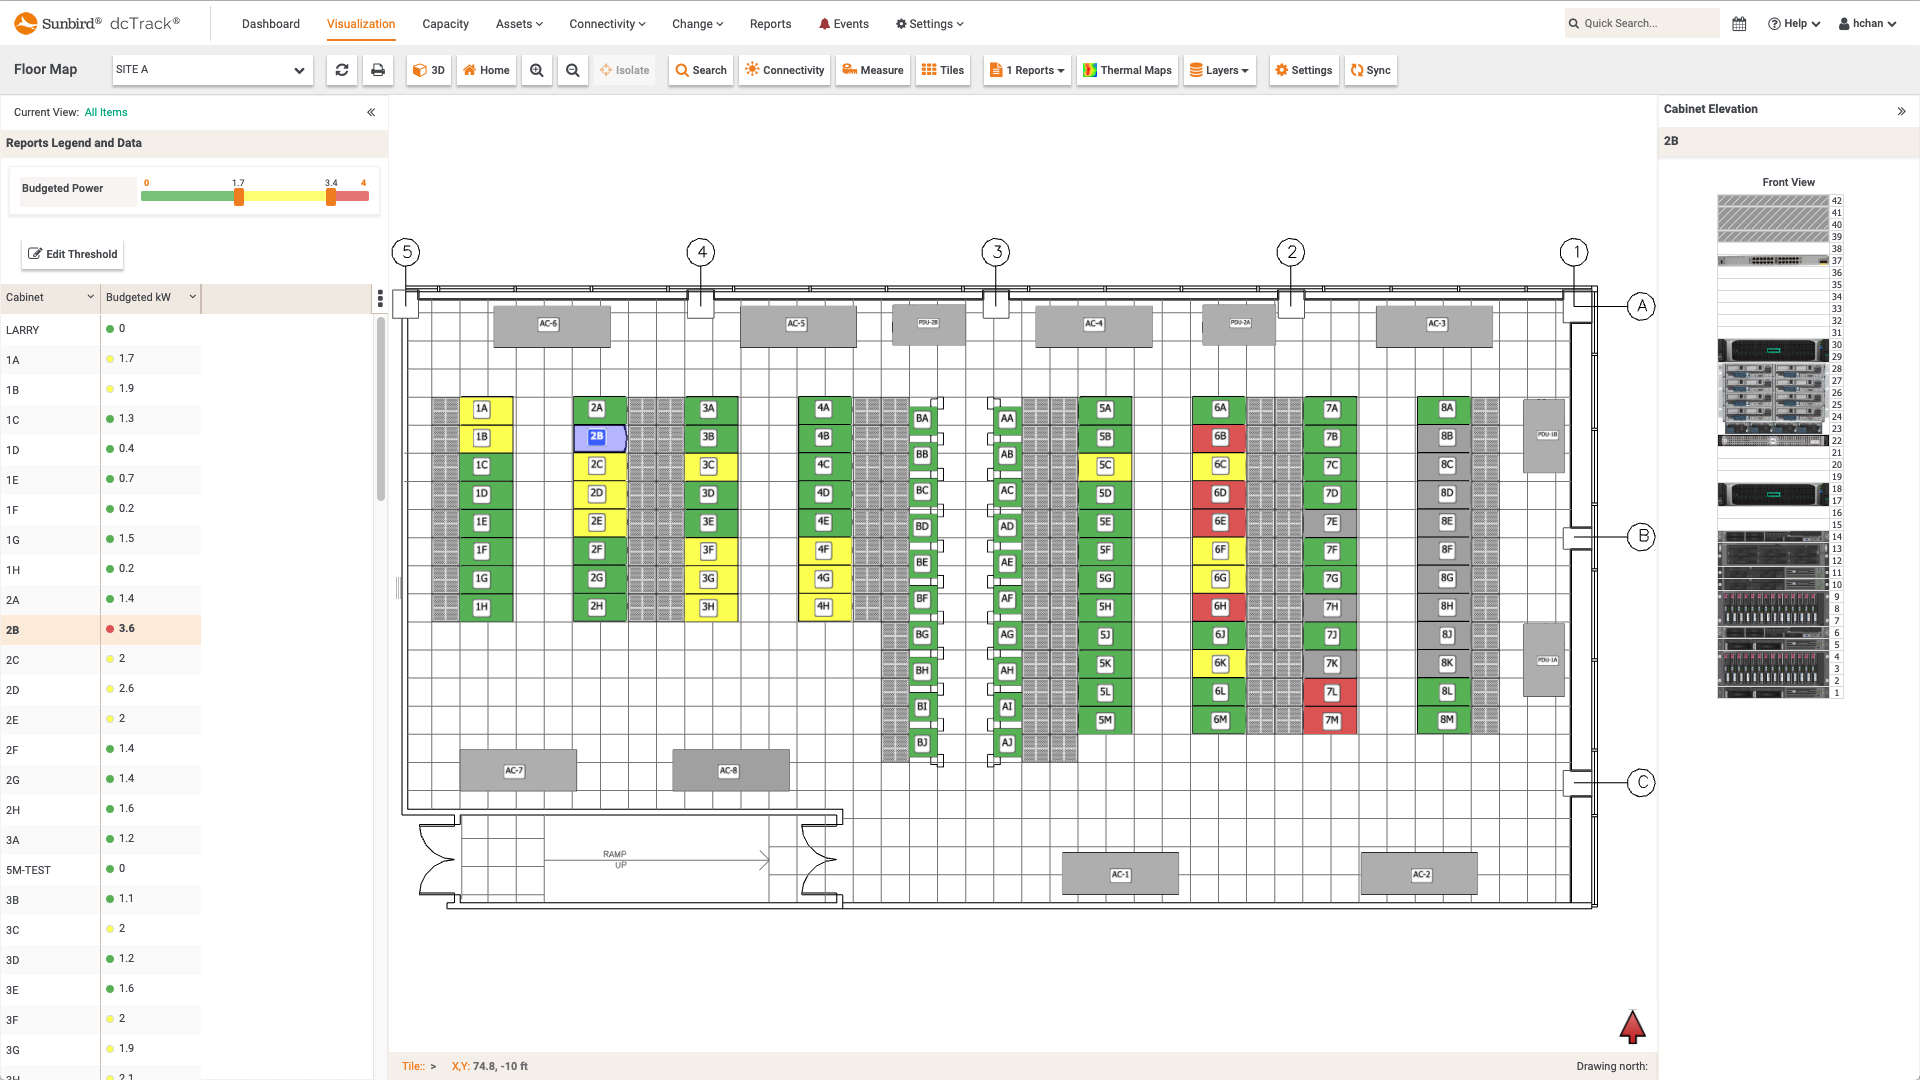
 dcTrack DCIM Operations | Power Management | BI & Data Analytics | VisualizationBudgeted Power per Cabinet Floor Map Report
 -
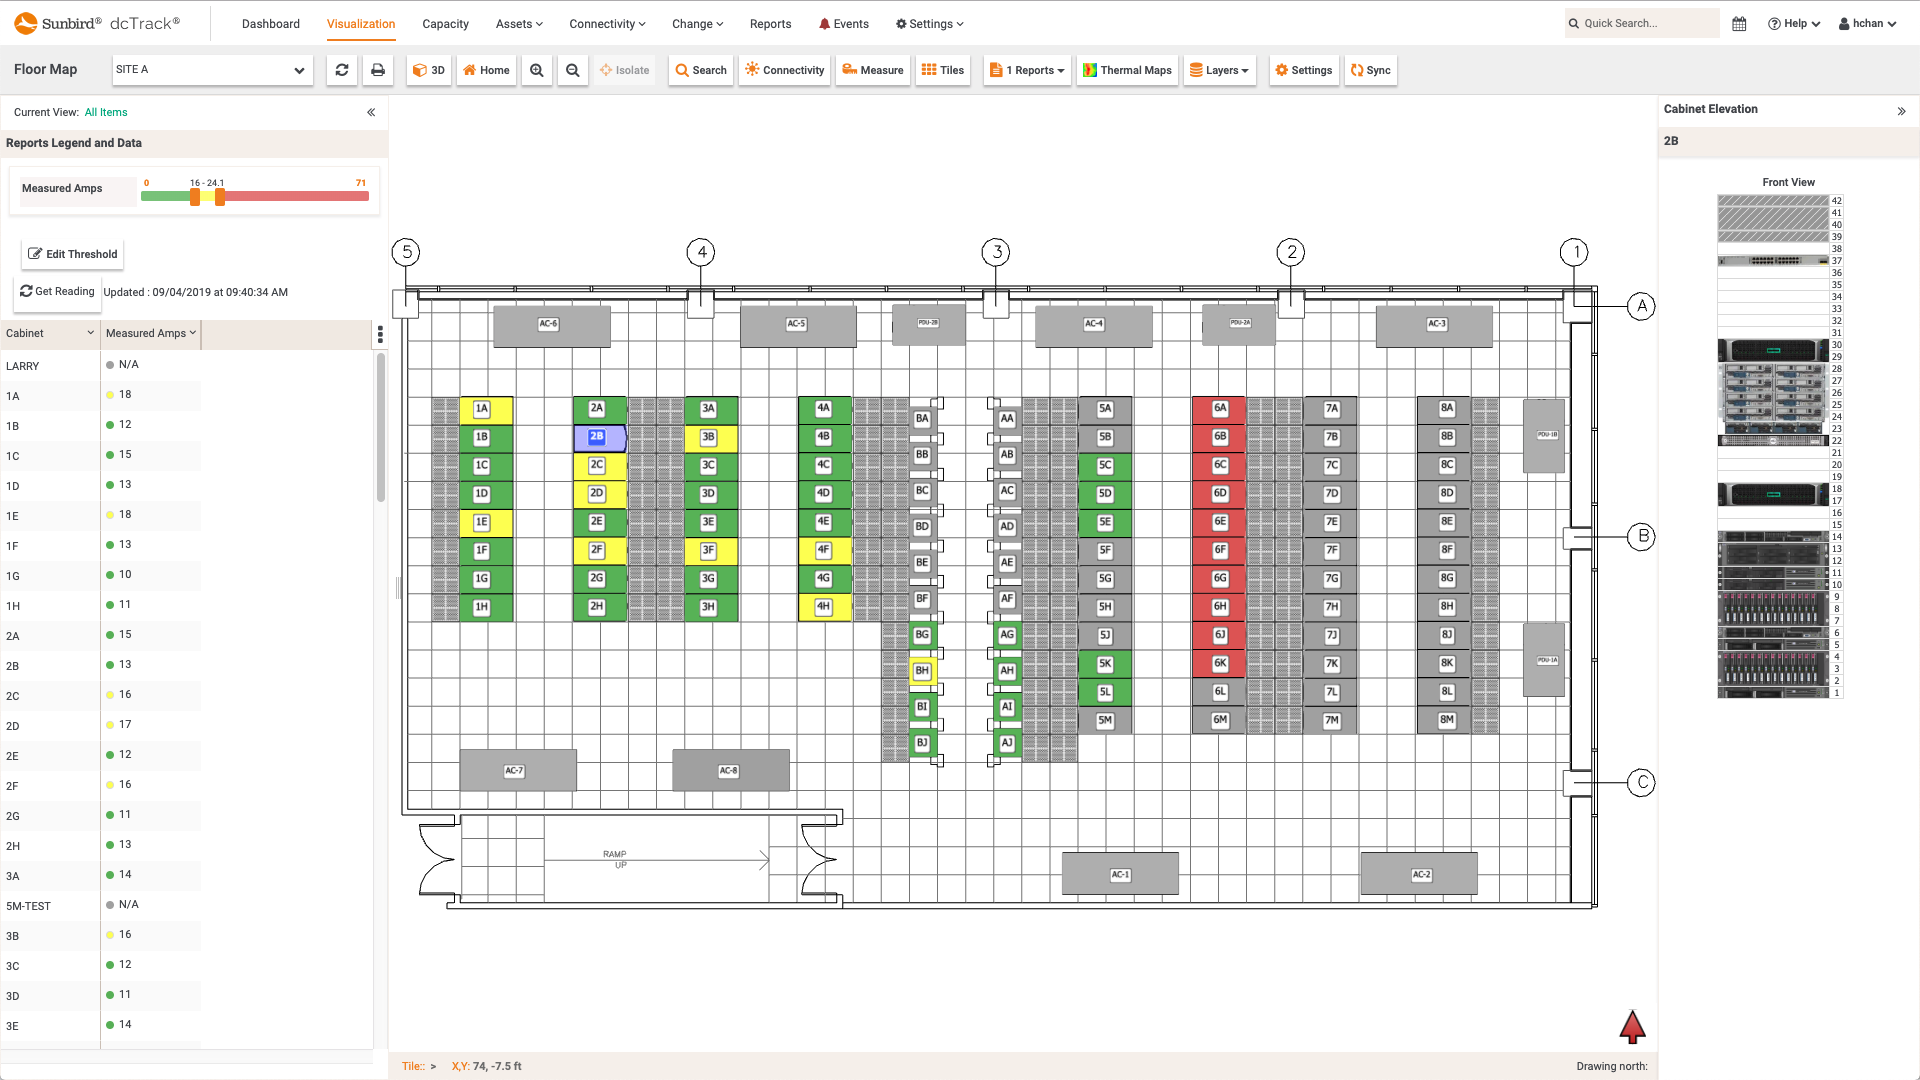
 dcTrack DCIM Operations | Power Management | BI & Data Analytics | VisualizationMeasured Amps per Cabinet Floor Map Report
 -
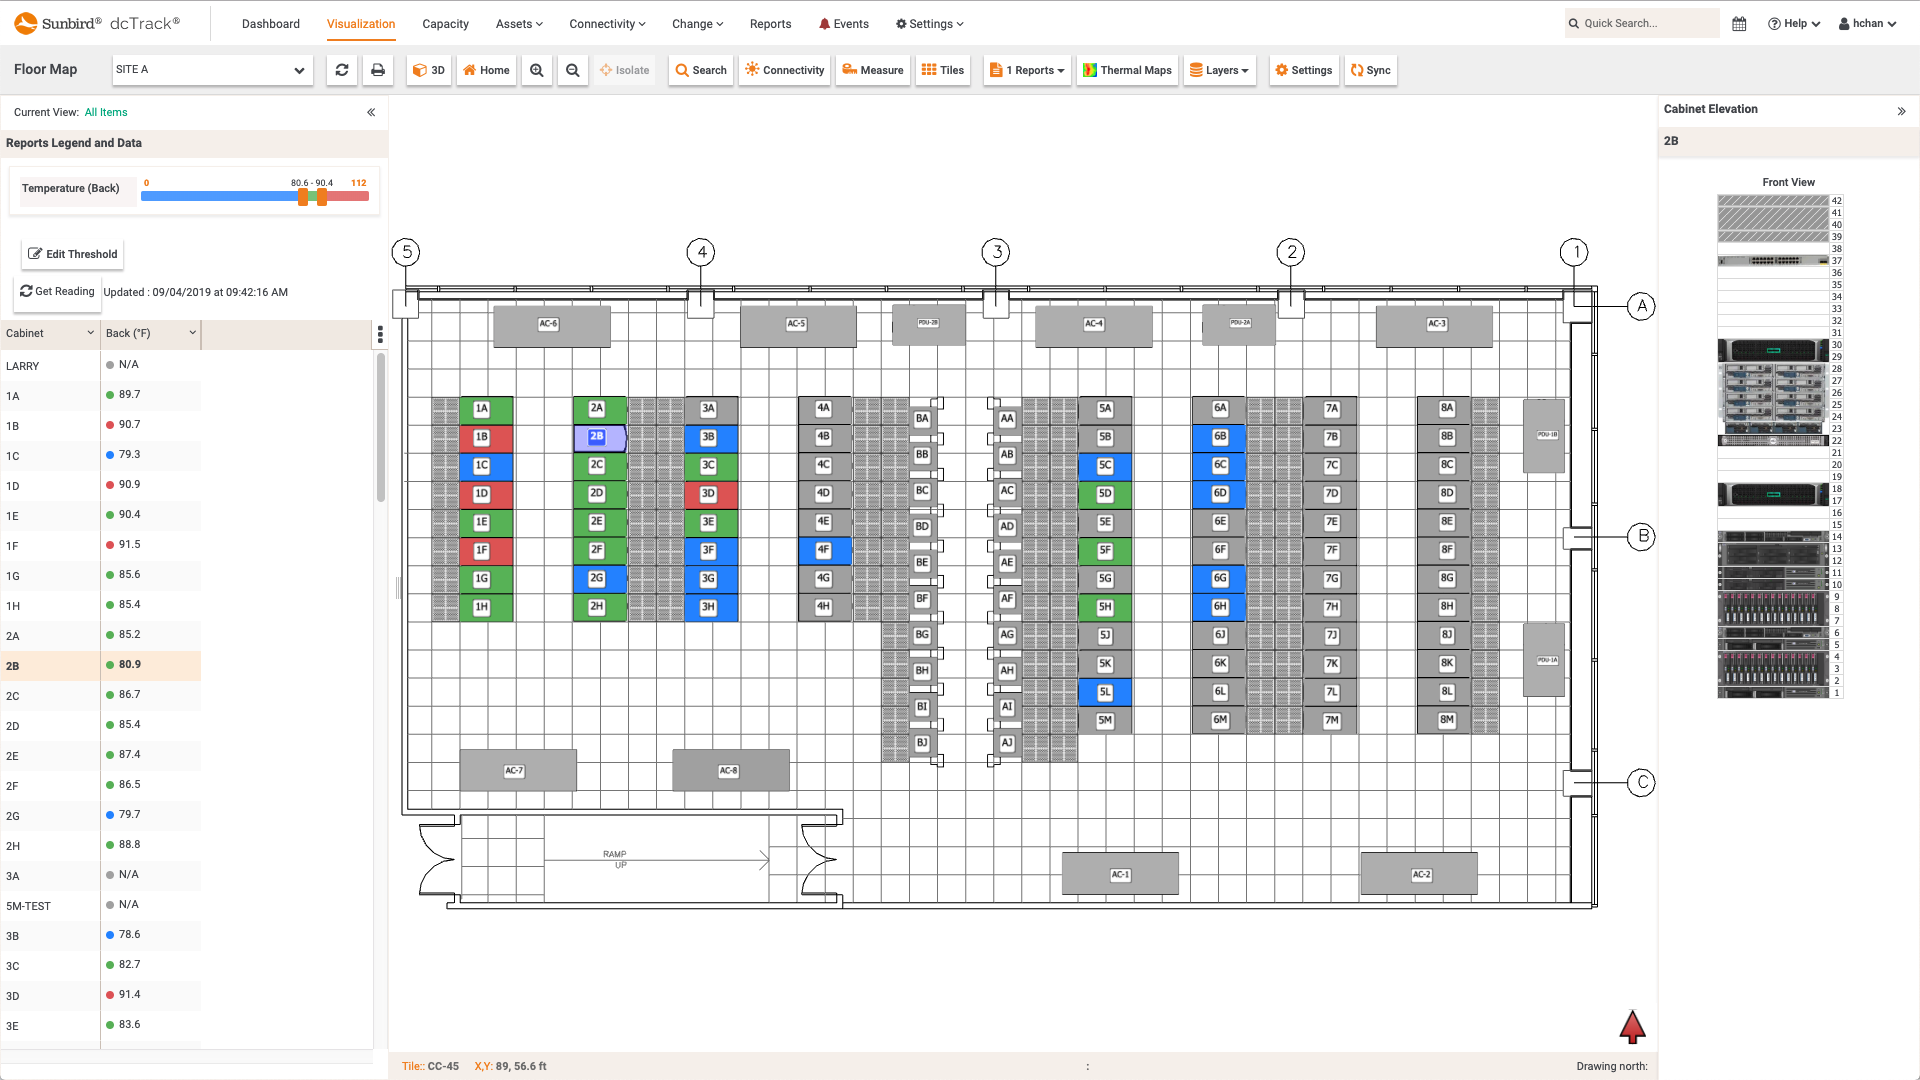
 Floor Map Report") dcTrack DCIM Operations | Environment Management | BI & Data Analytics | VisualizationMax Temperature per Cabinet (Rear) Floor Map Report
dcTrack DCIM Operations | Environment Management | BI & Data Analytics | VisualizationMax Temperature per Cabinet (Rear) Floor Map Report -
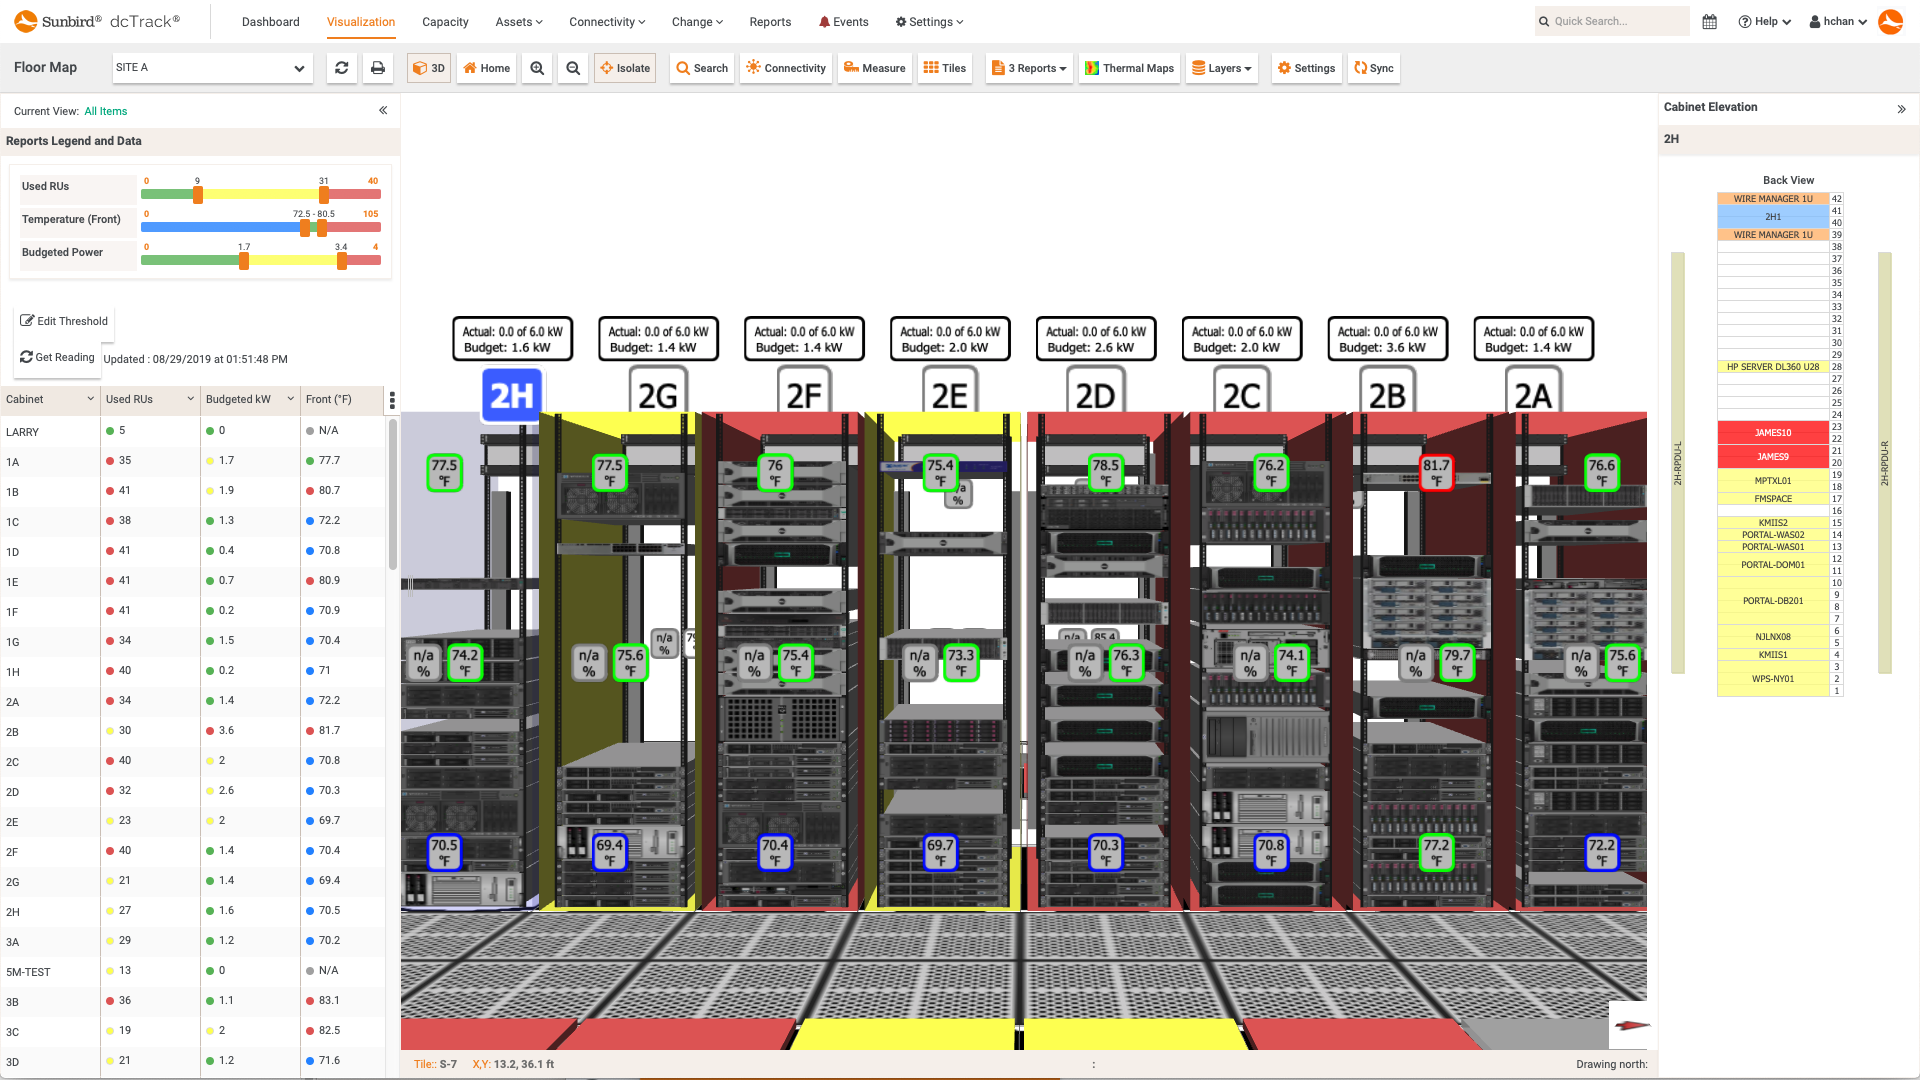
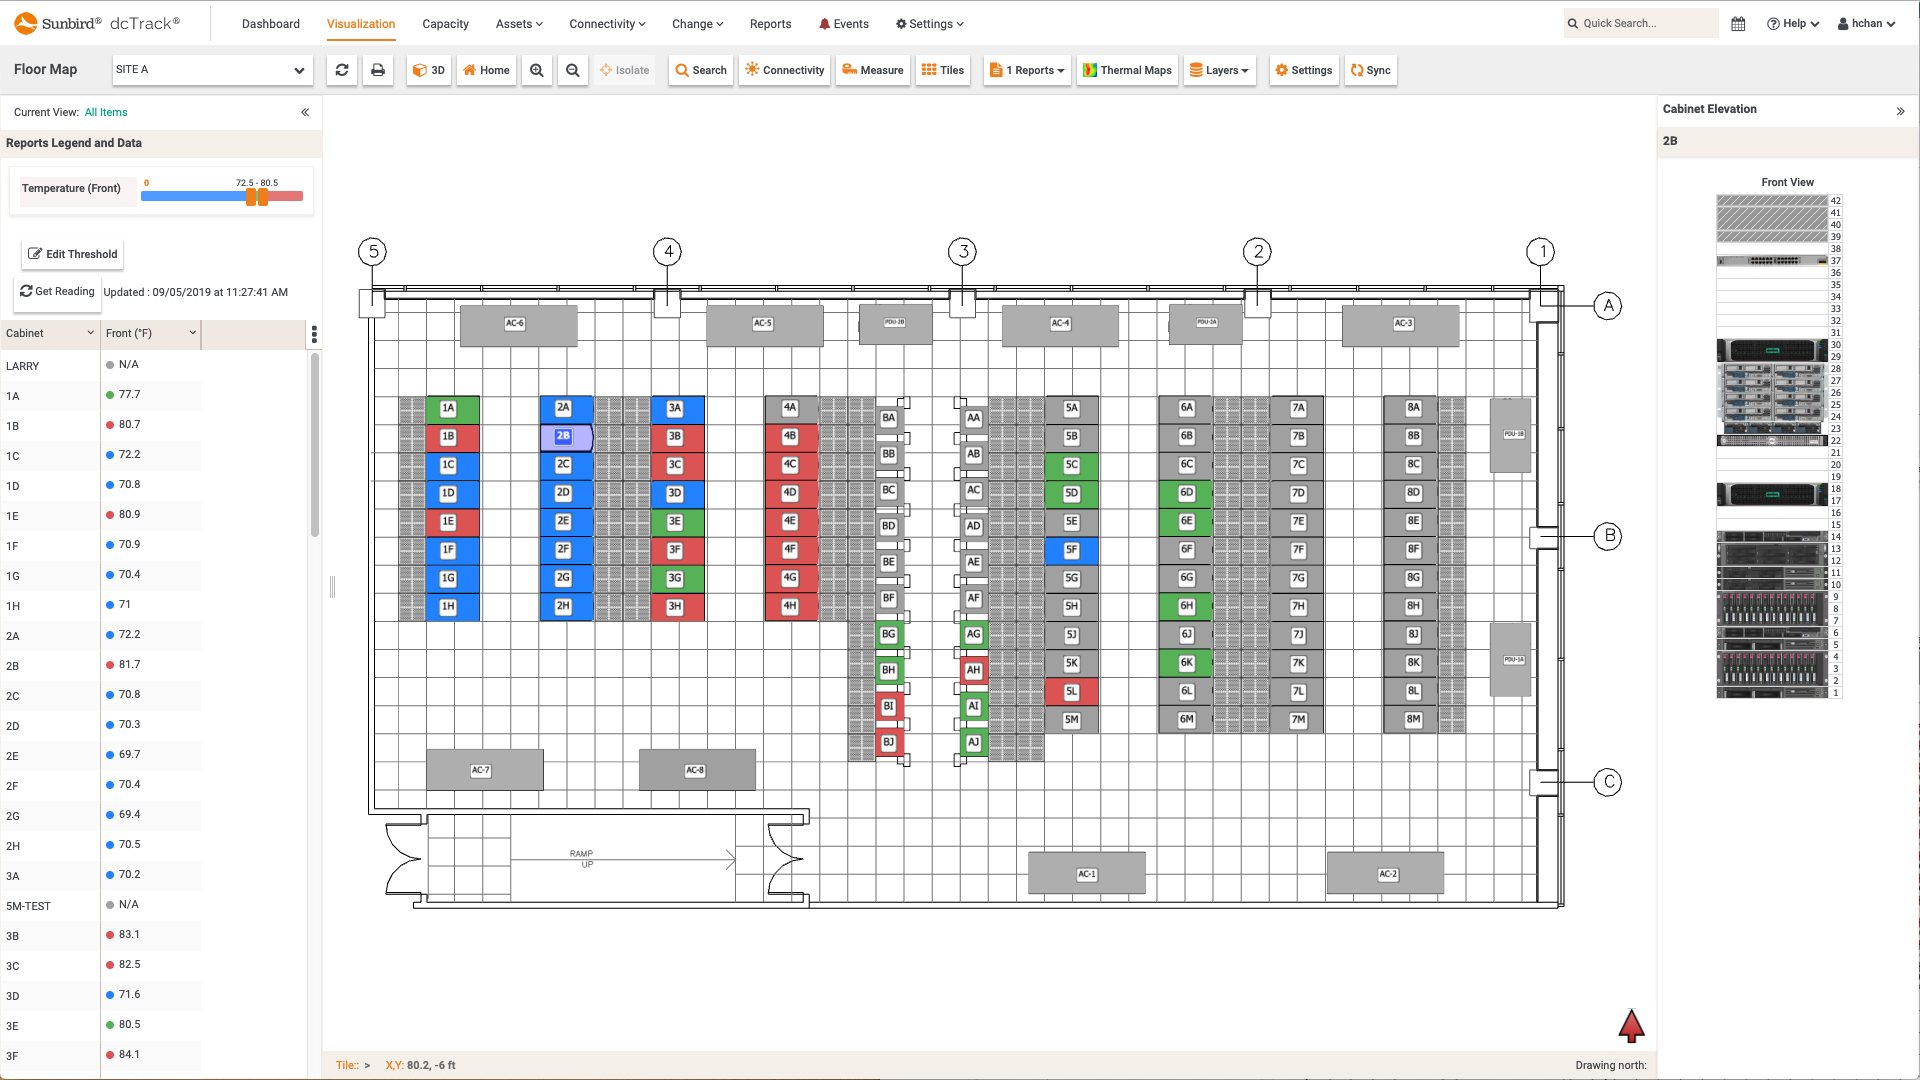
 per Cabinet Floor Map Report") dcTrack DCIM Operations | Environment Management | BI & Data Analytics | VisualizationTemperature (Front) per Cabinet Floor Map Report
dcTrack DCIM Operations | Environment Management | BI & Data Analytics | VisualizationTemperature (Front) per Cabinet Floor Map Report -
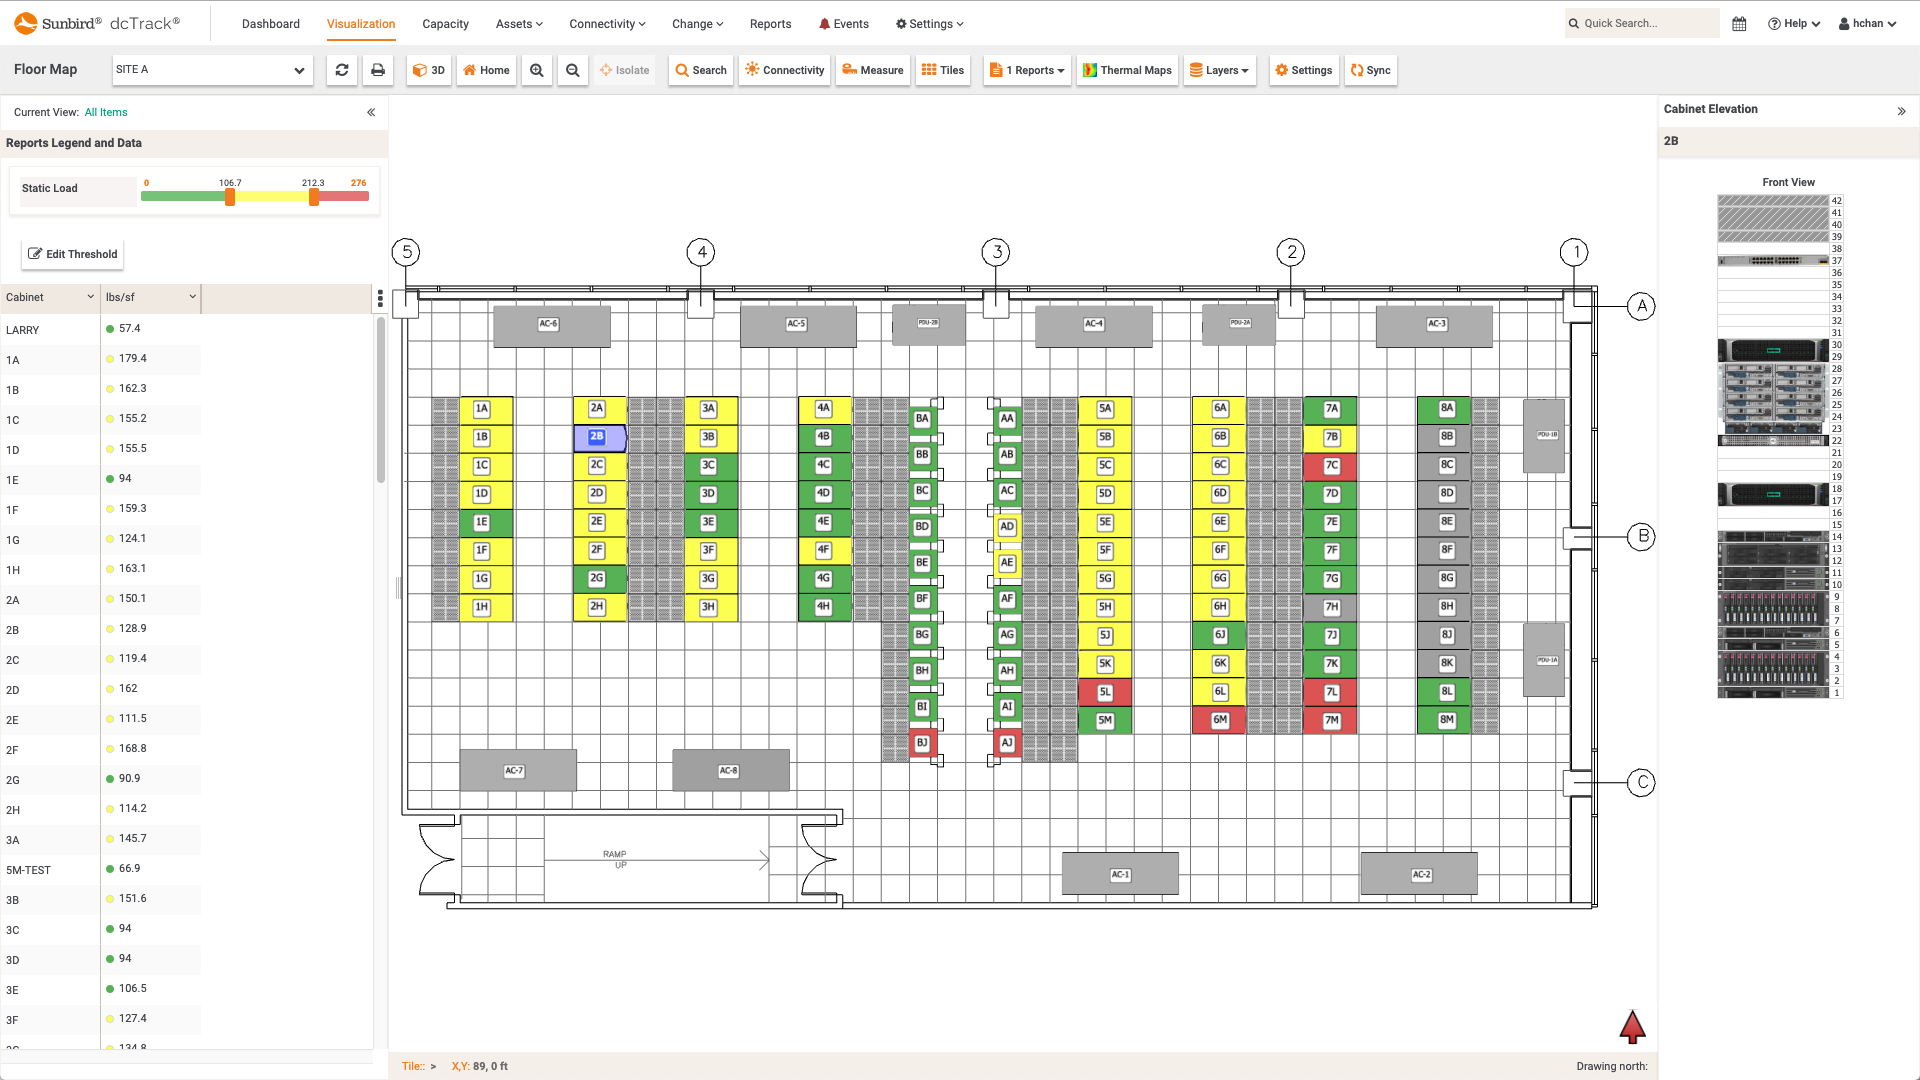
 dcTrack DCIM Operations | Capacity Management | BI & Data Analytics | VisualizationStatic Load per Cabinet Floor Map Report
 -
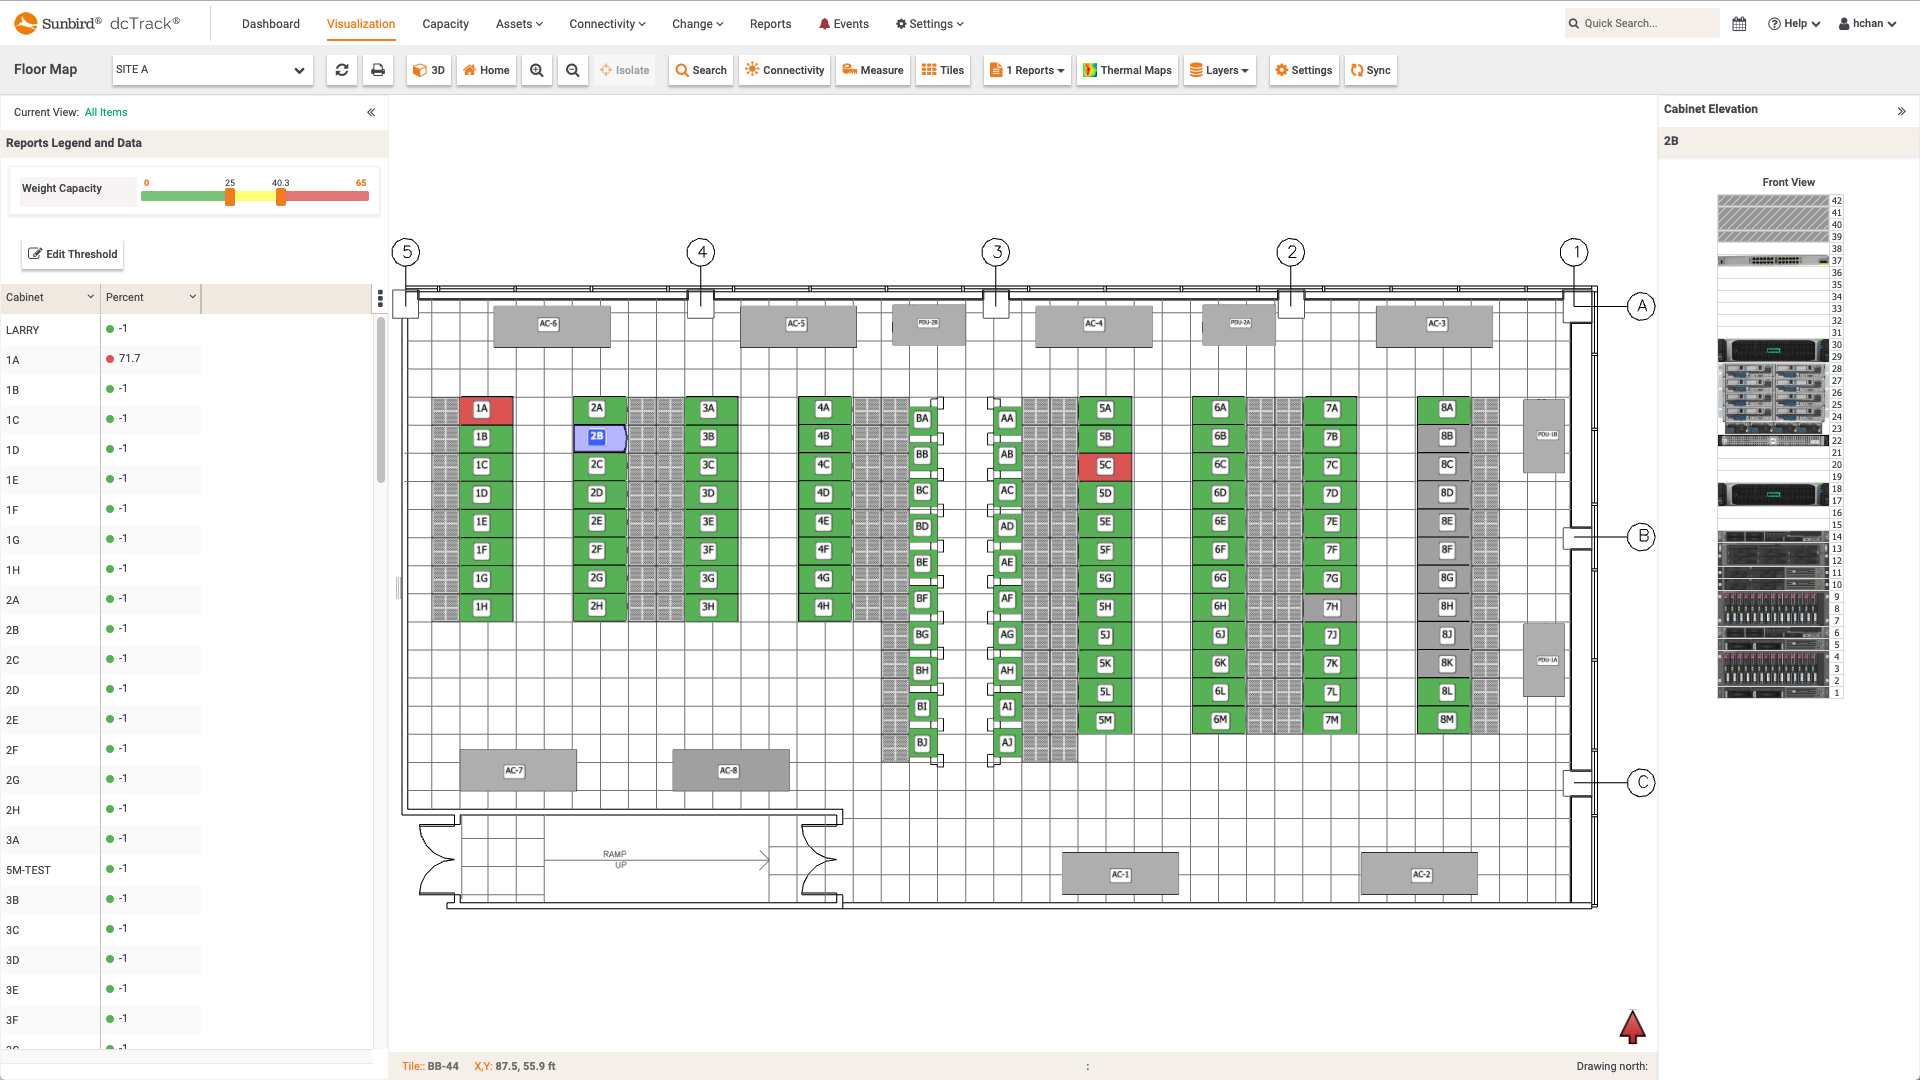
 dcTrack DCIM Operations | Capacity Management | BI & Data Analytics | VisualizationWeight Capacity per Cabinet Floor Map Report
 -
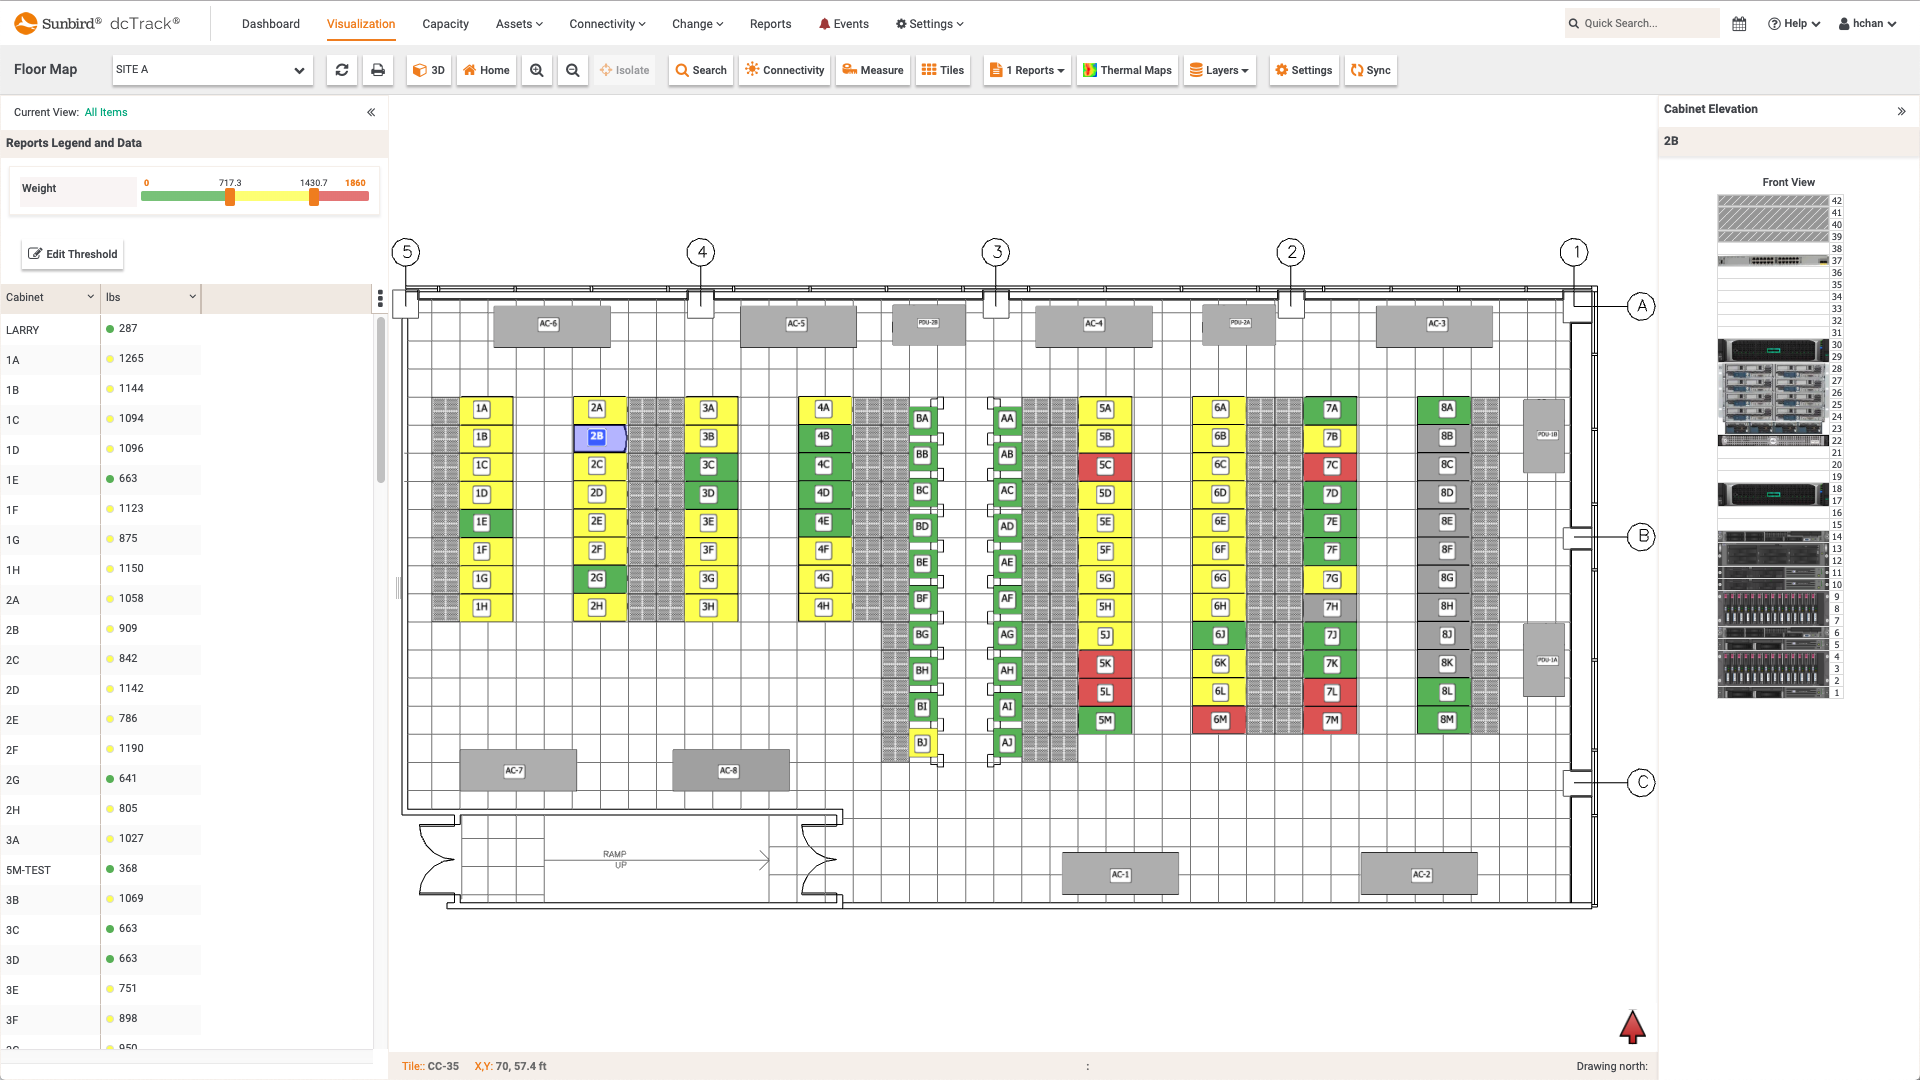
 dcTrack DCIM Operations | Capacity Management | BI & Data Analytics | VisualizationWeight per Cabinet Floor Map Report
 -
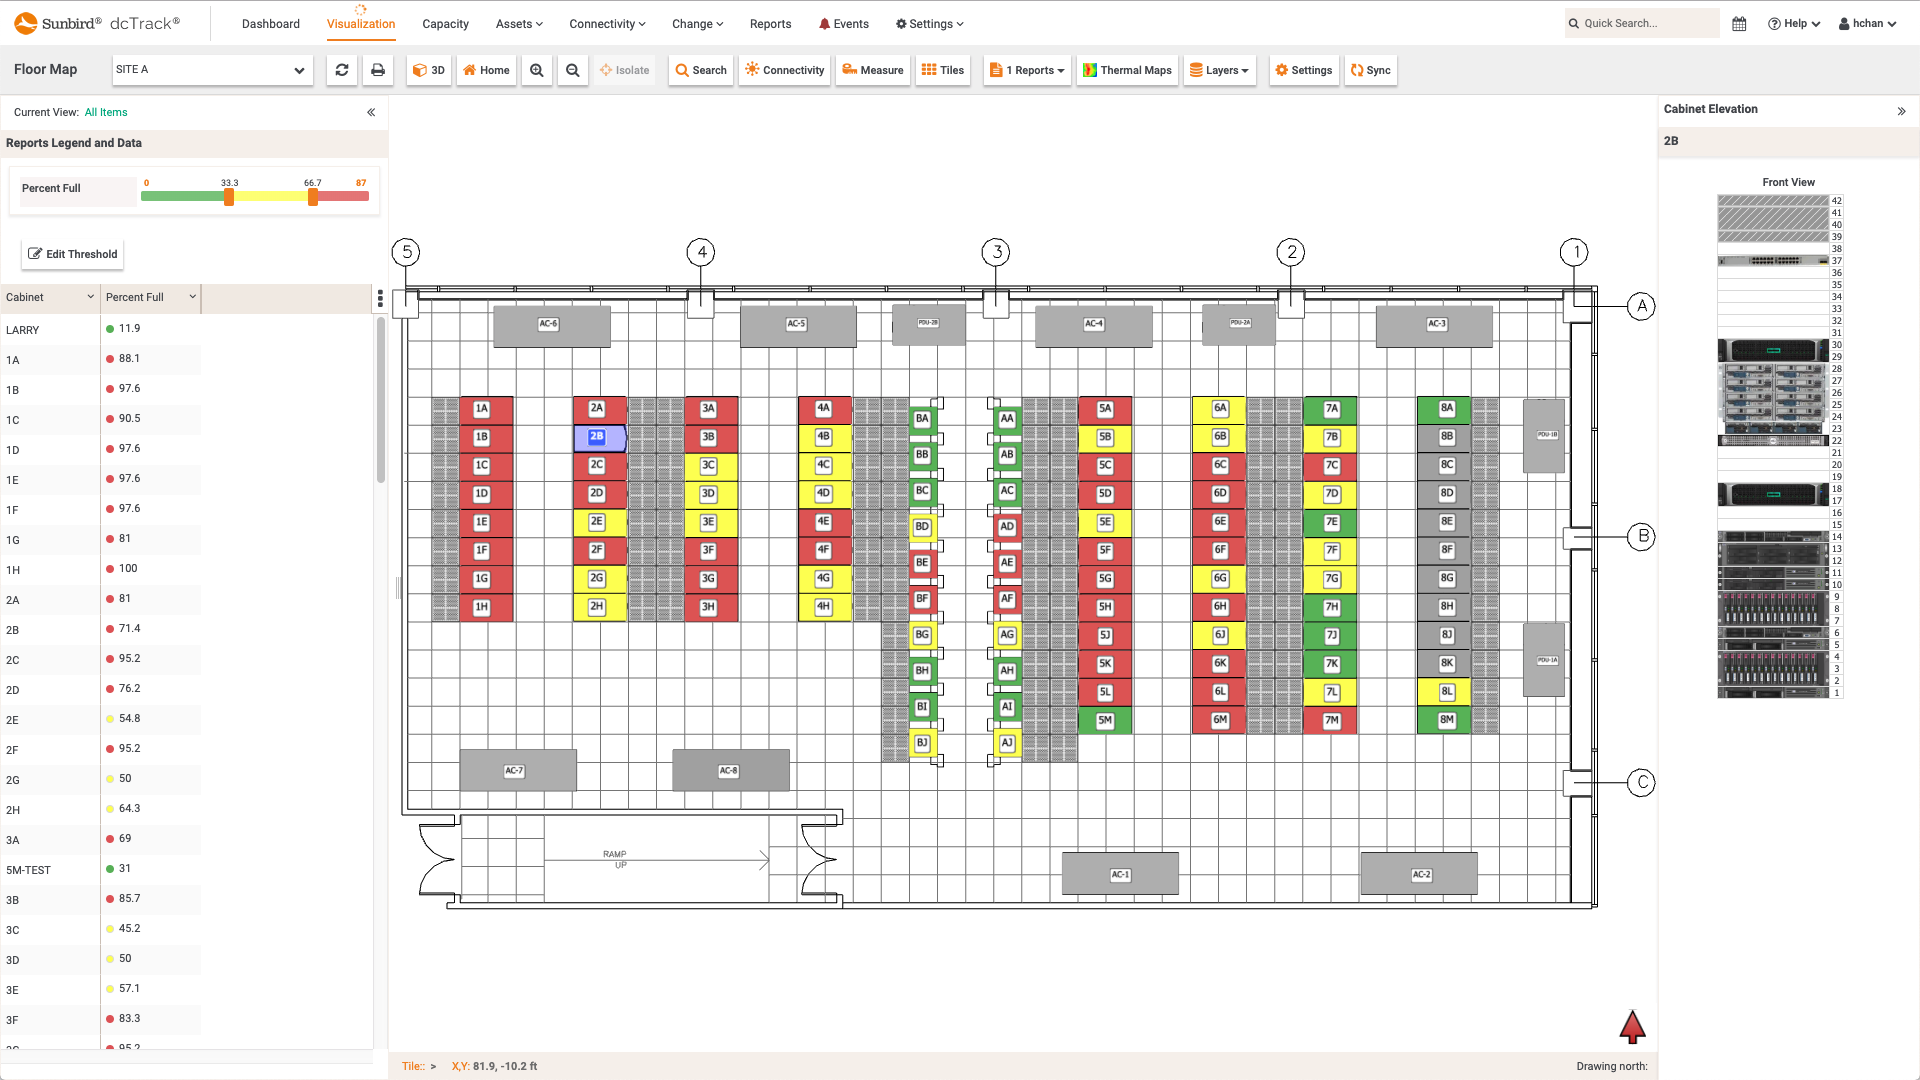
 dcTrack DCIM Operations | Capacity Management | BI & Data Analytics | VisualizationPercent Full per Cabinet Floor Map Report
 -
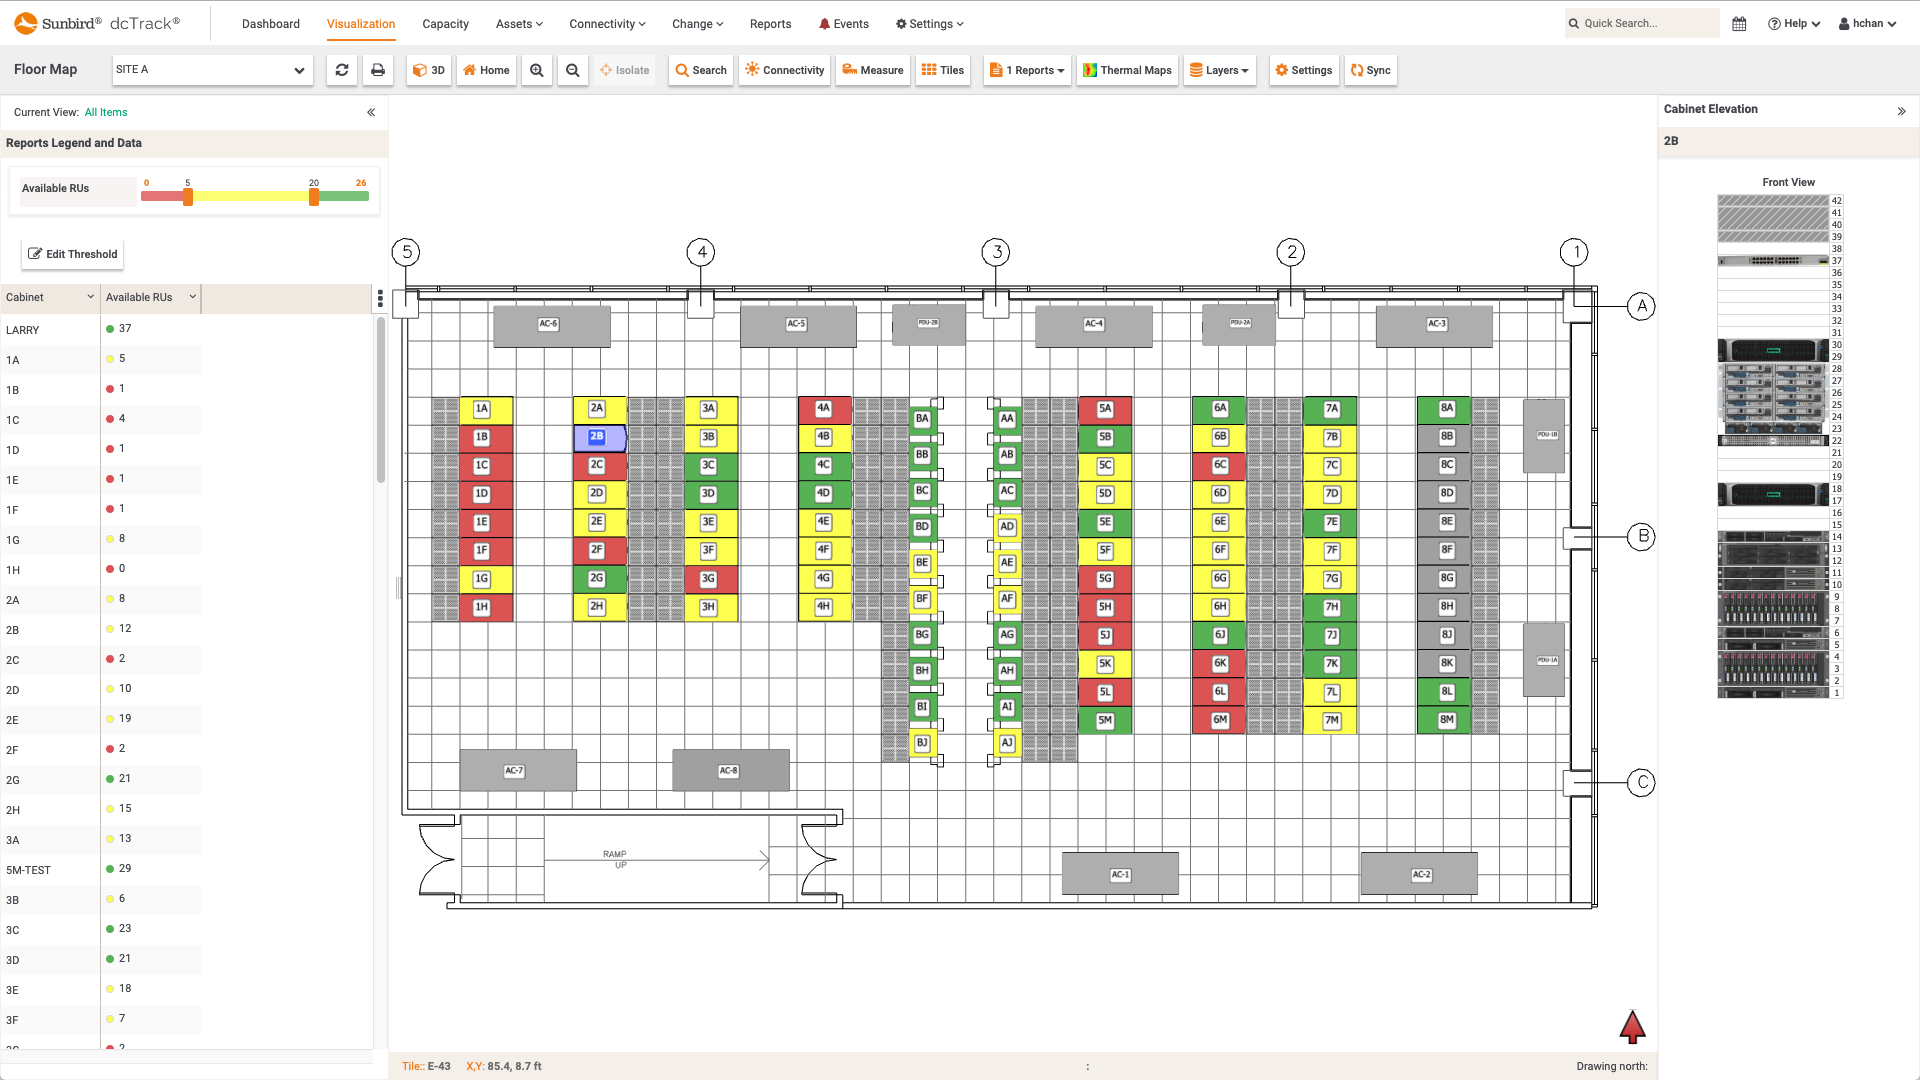
 dcTrack DCIM Operations | Capacity Management | BI & Data Analytics | VisualizationAvailable RUs per Cabinet Floor Map Report
 -
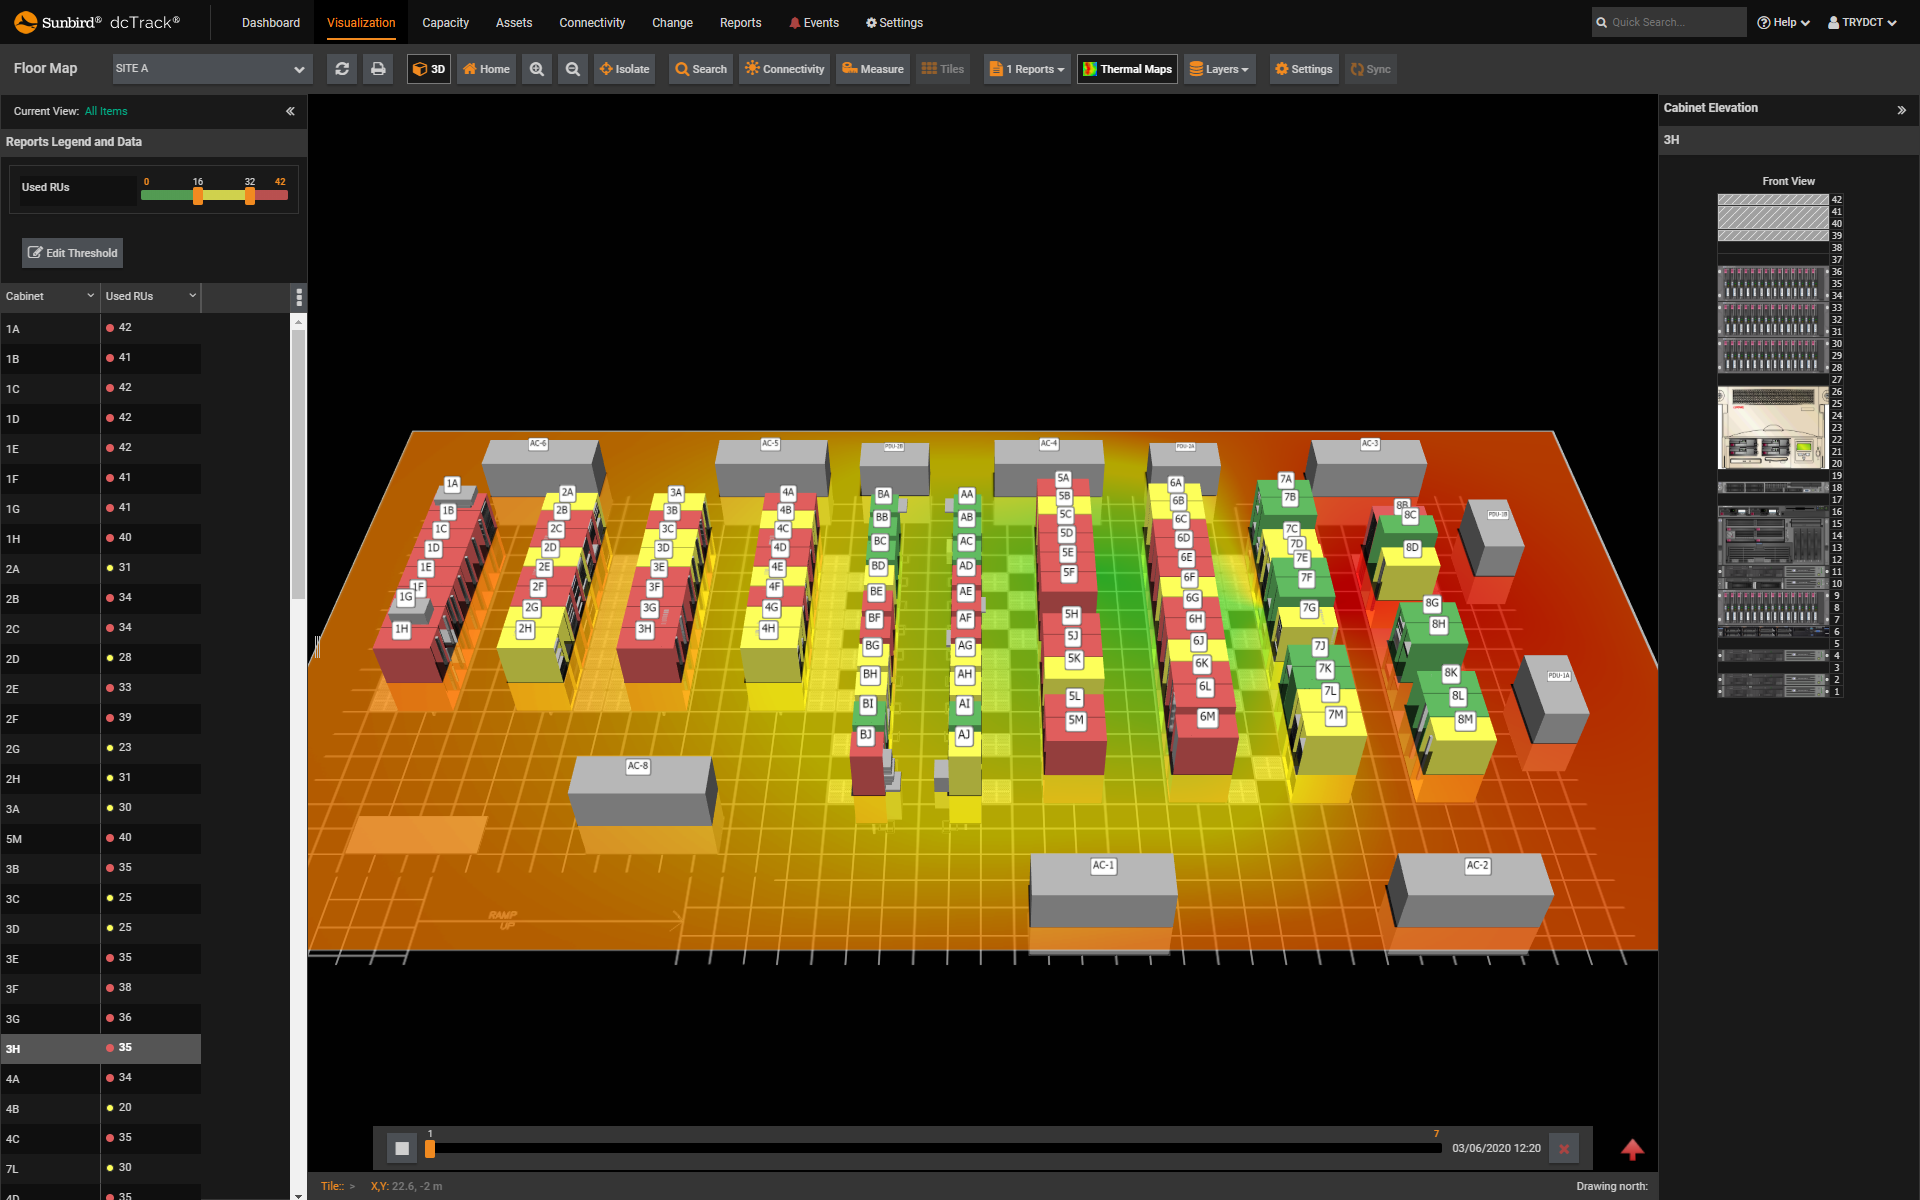
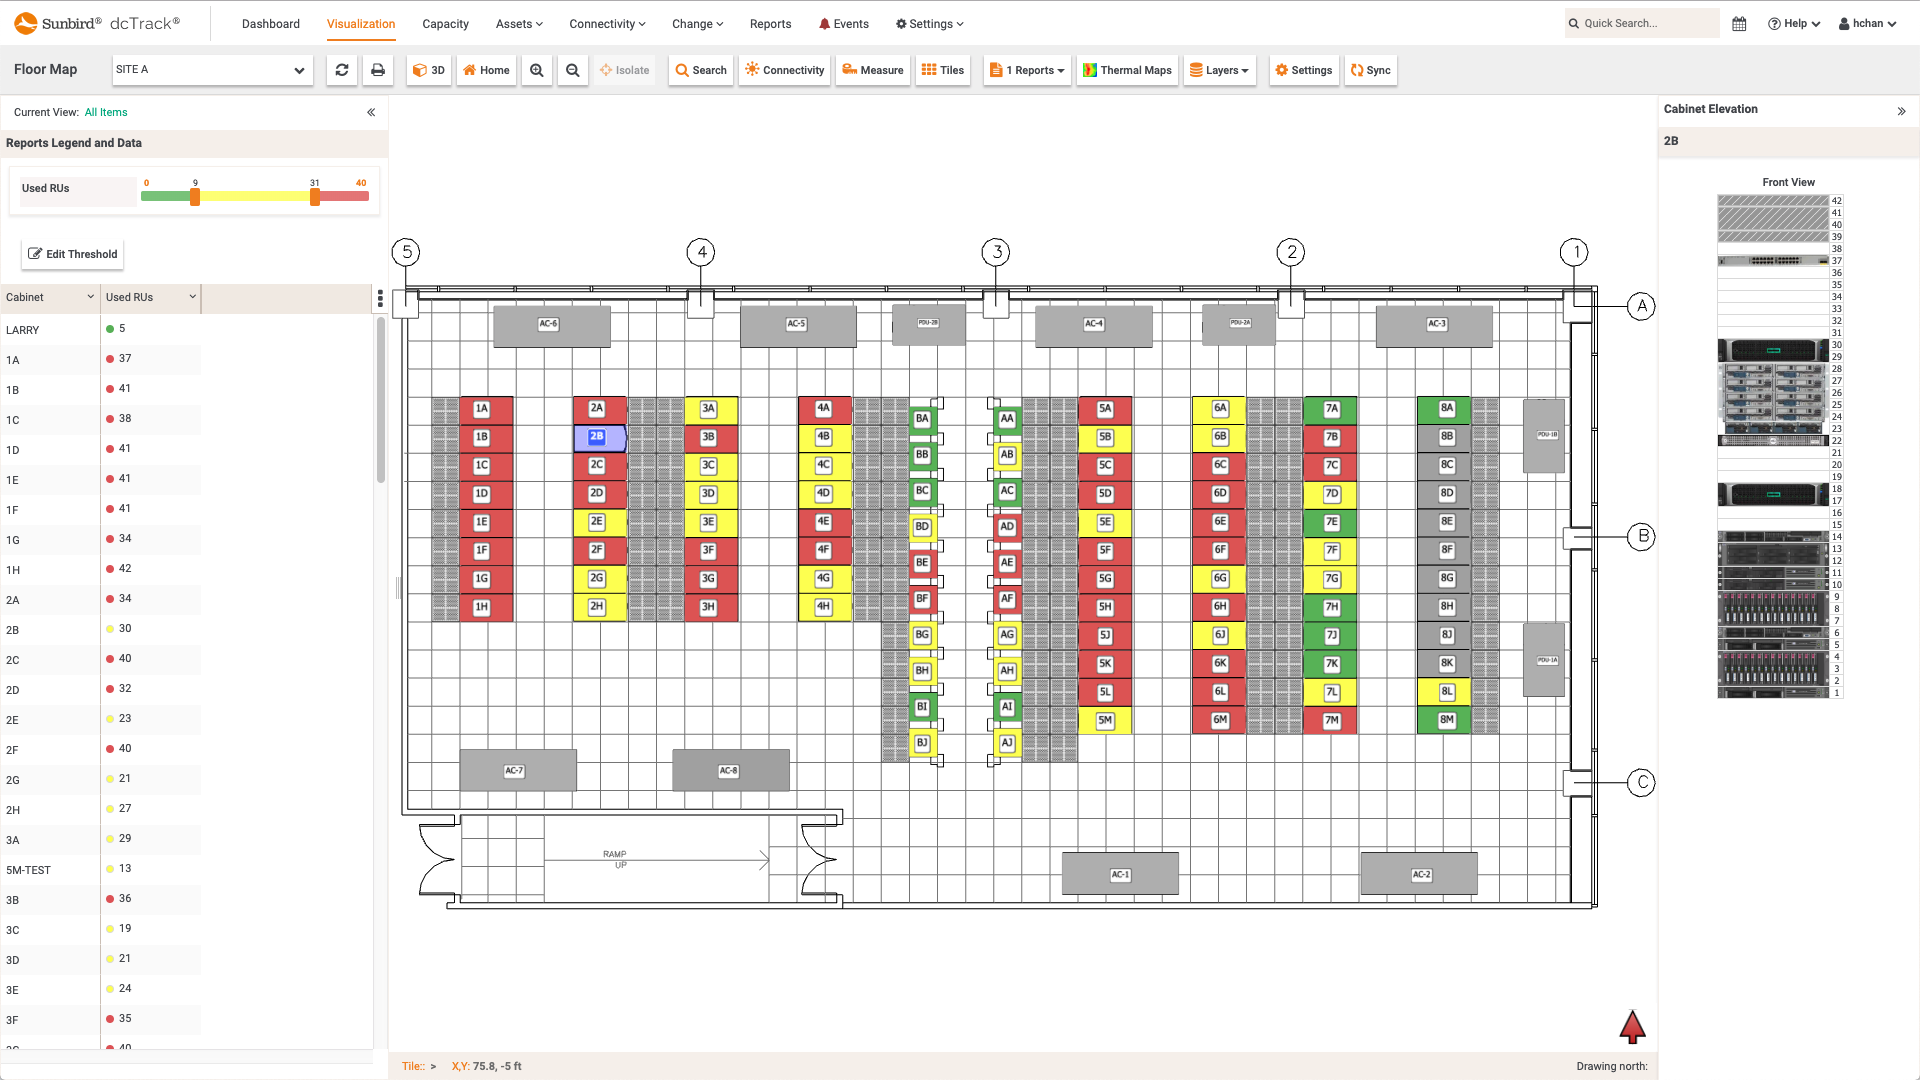
 dcTrack DCIM Operations | Capacity Management | BI & Data Analytics | VisualizationUsed RUs per Cabinet Floor Map Report
 -
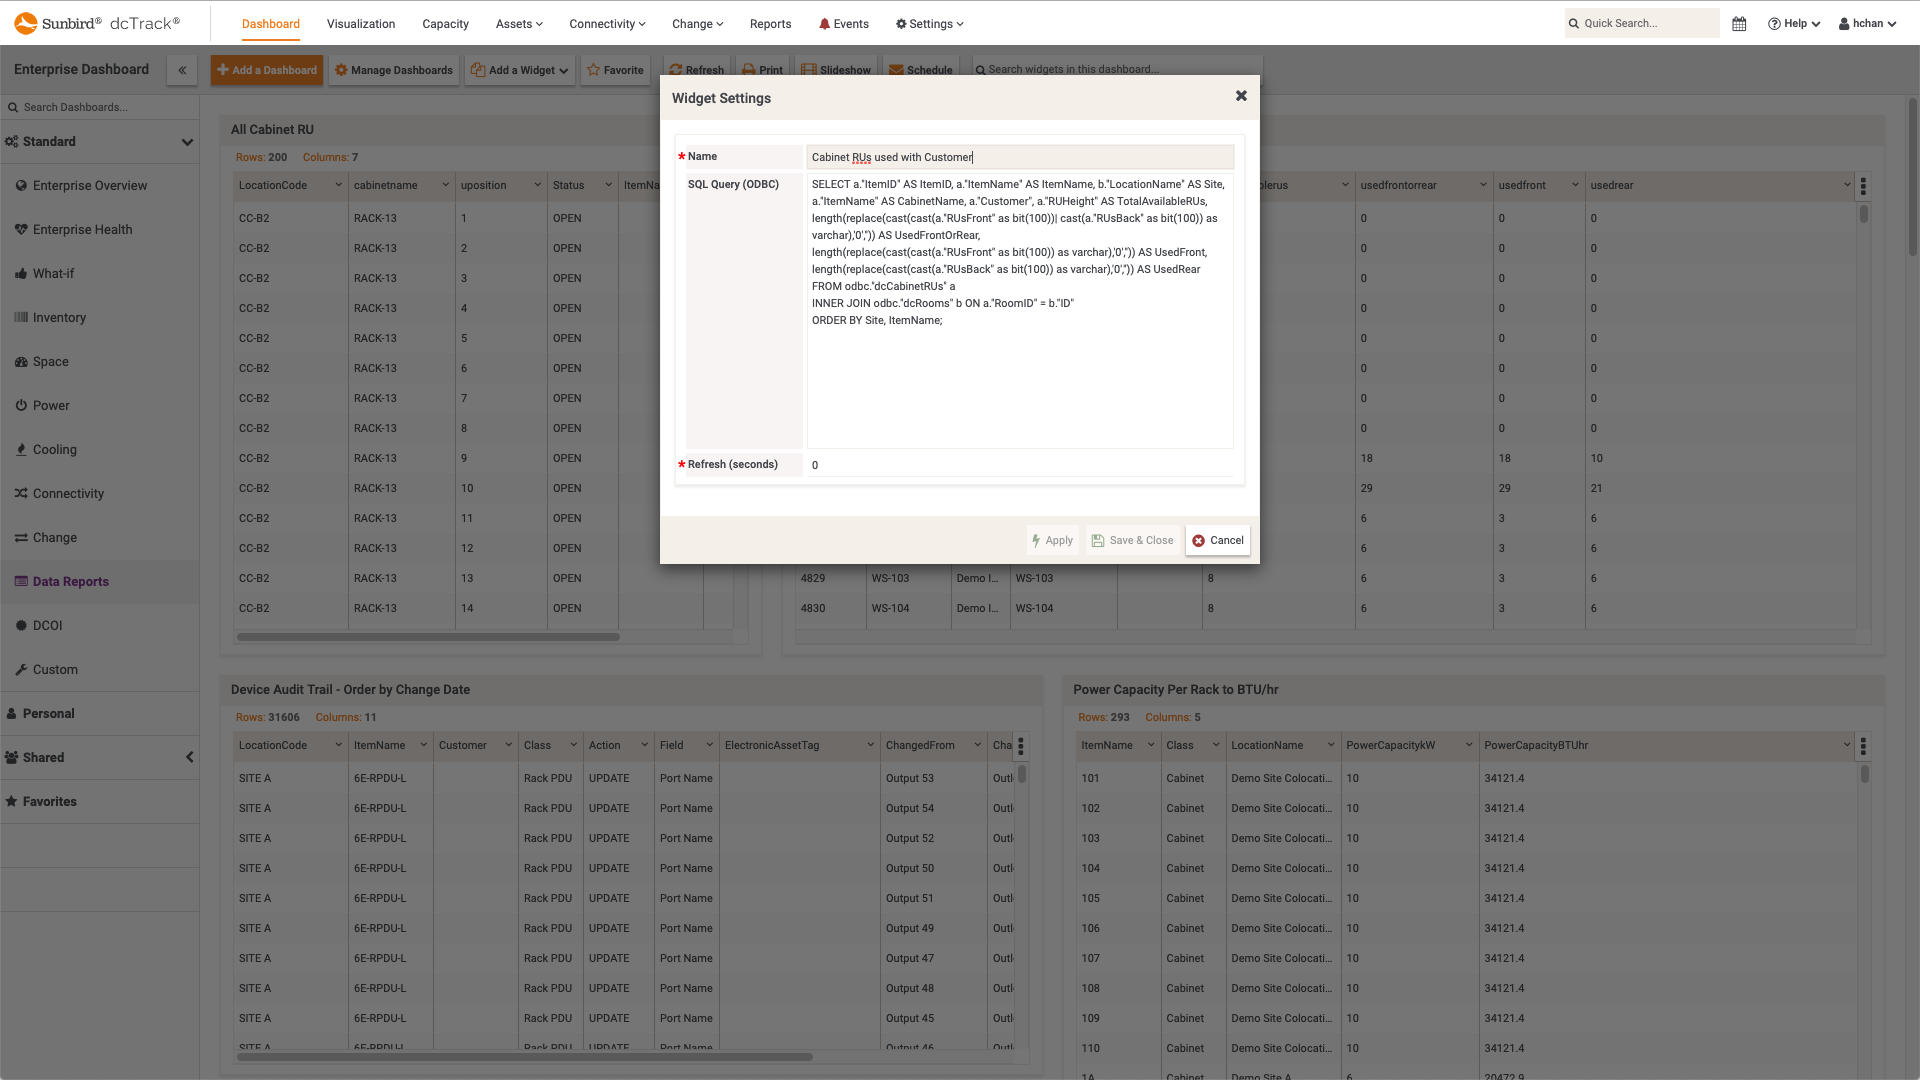
 dcTrack DCIM Operations | BI & Data AnalyticsAdding SQL Query Report Widget
 -
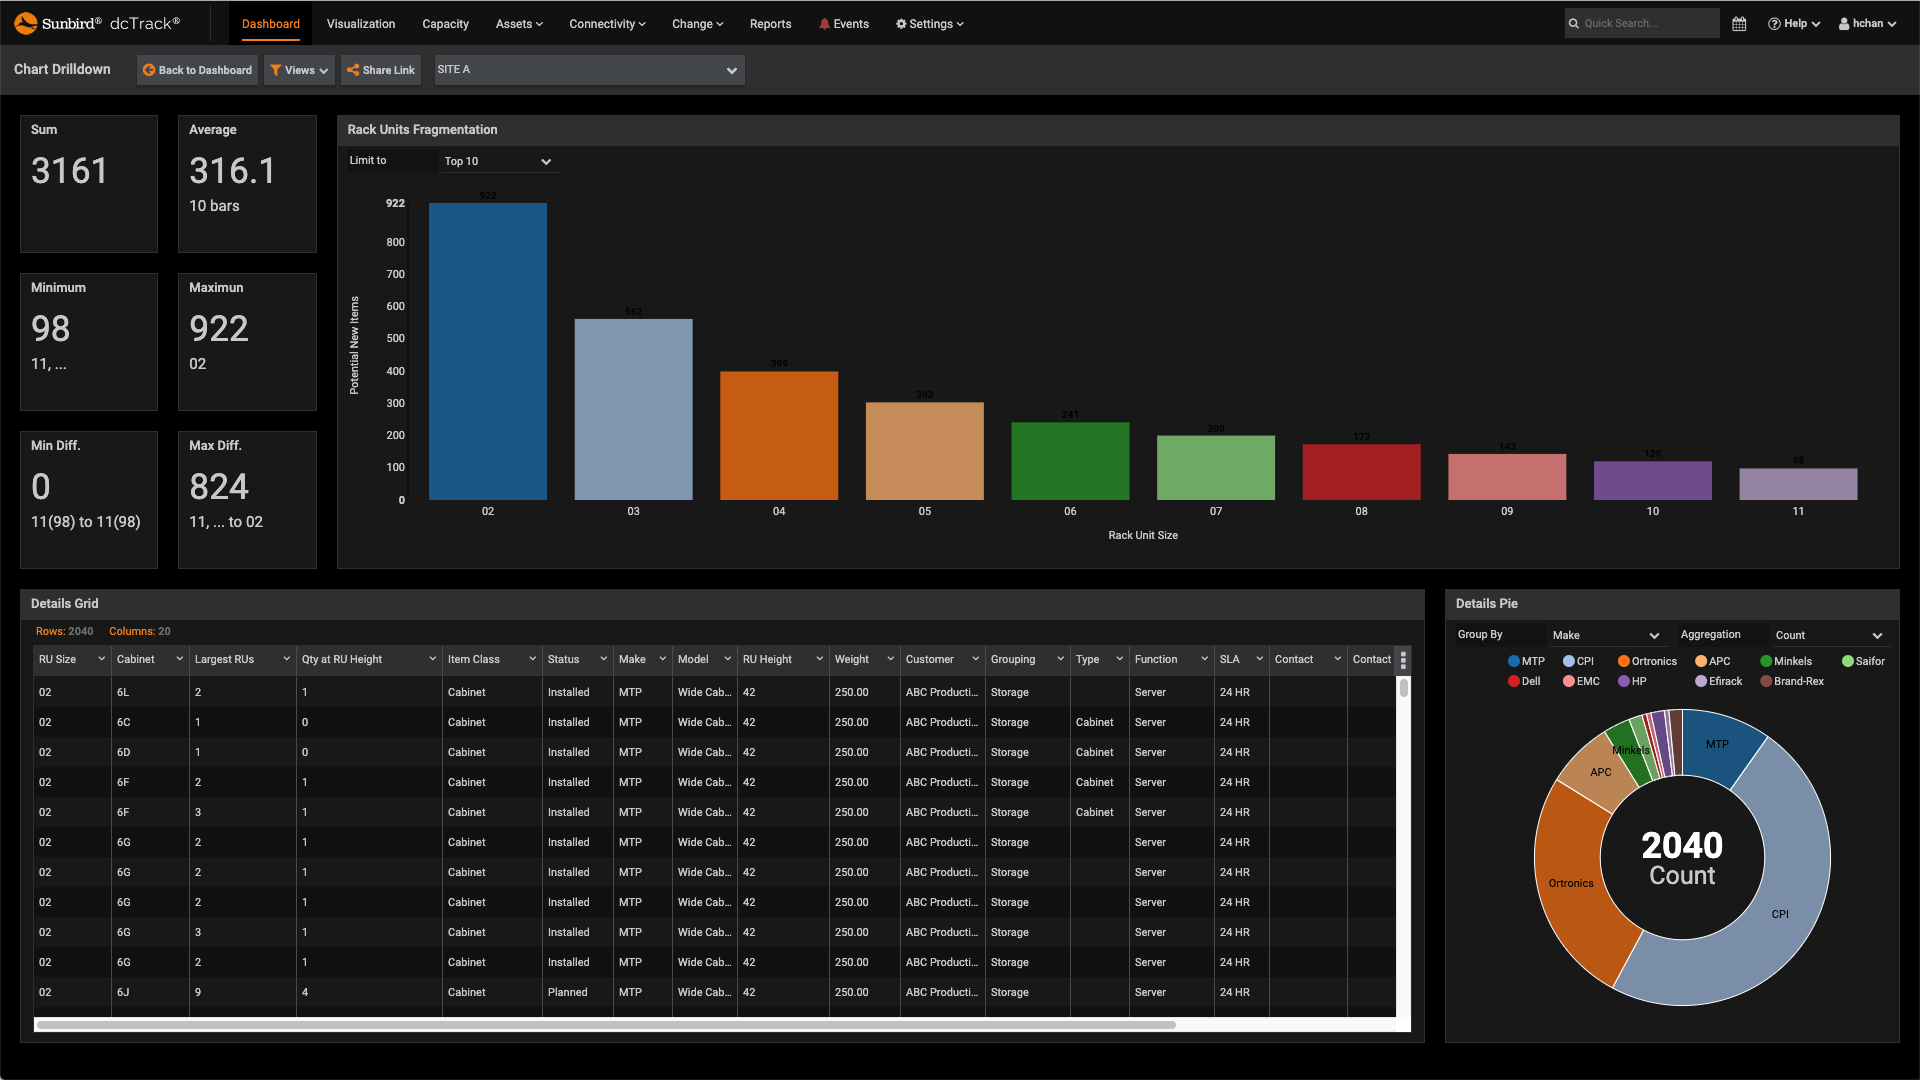
 dcTrack DCIM Operations | BI & Data Analytics | DashboardsDashboard Widget Drill Down Report
 -
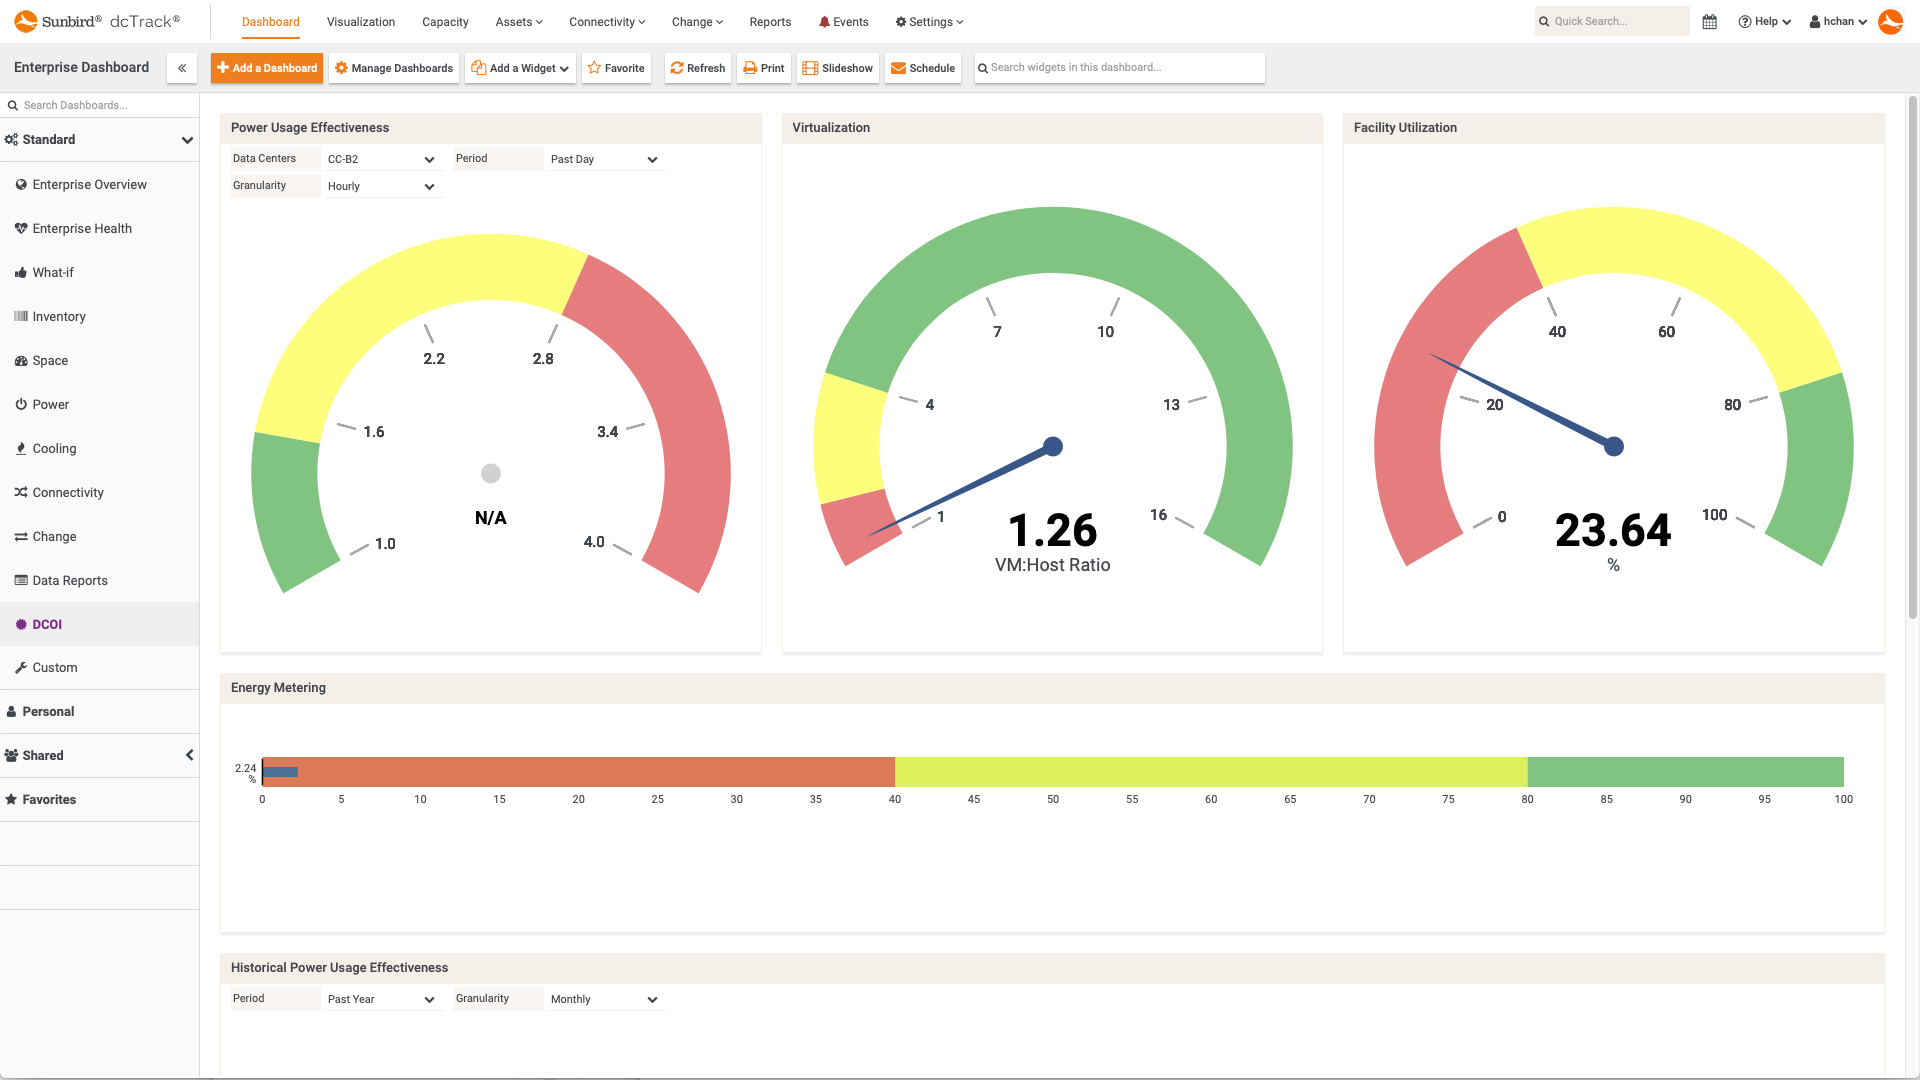
 dcTrack DCIM Operations | BI & Data Analytics | Energy Management | DashboardsDCOI Dashboard
 -
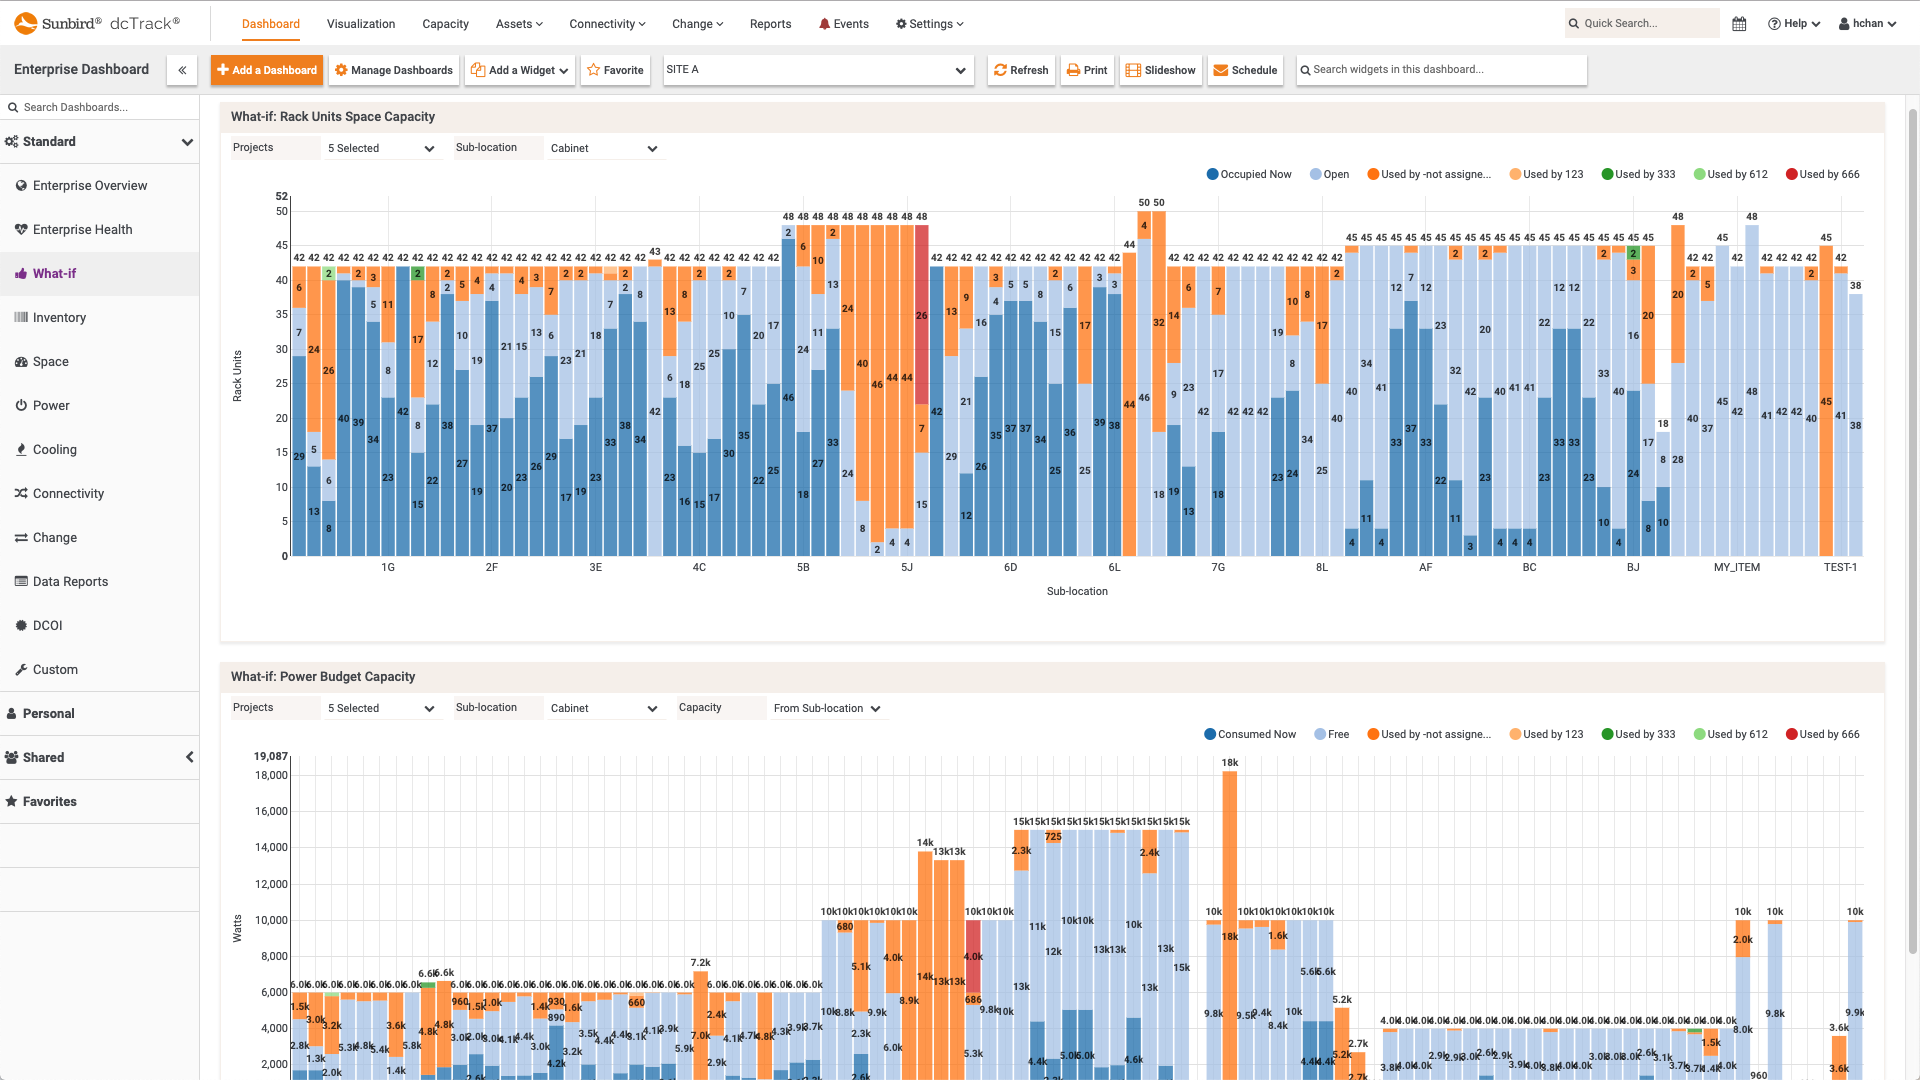
 dcTrack DCIM Operations | BI & Data Analytics | Capacity Management | DashboardsWhat If Analysis Dashboard
 -
 dcTrack DCIM Operations | BI & Data Analytics | DashboardsHTML and Web Cam Feeds for Dashboard Widgets
 -
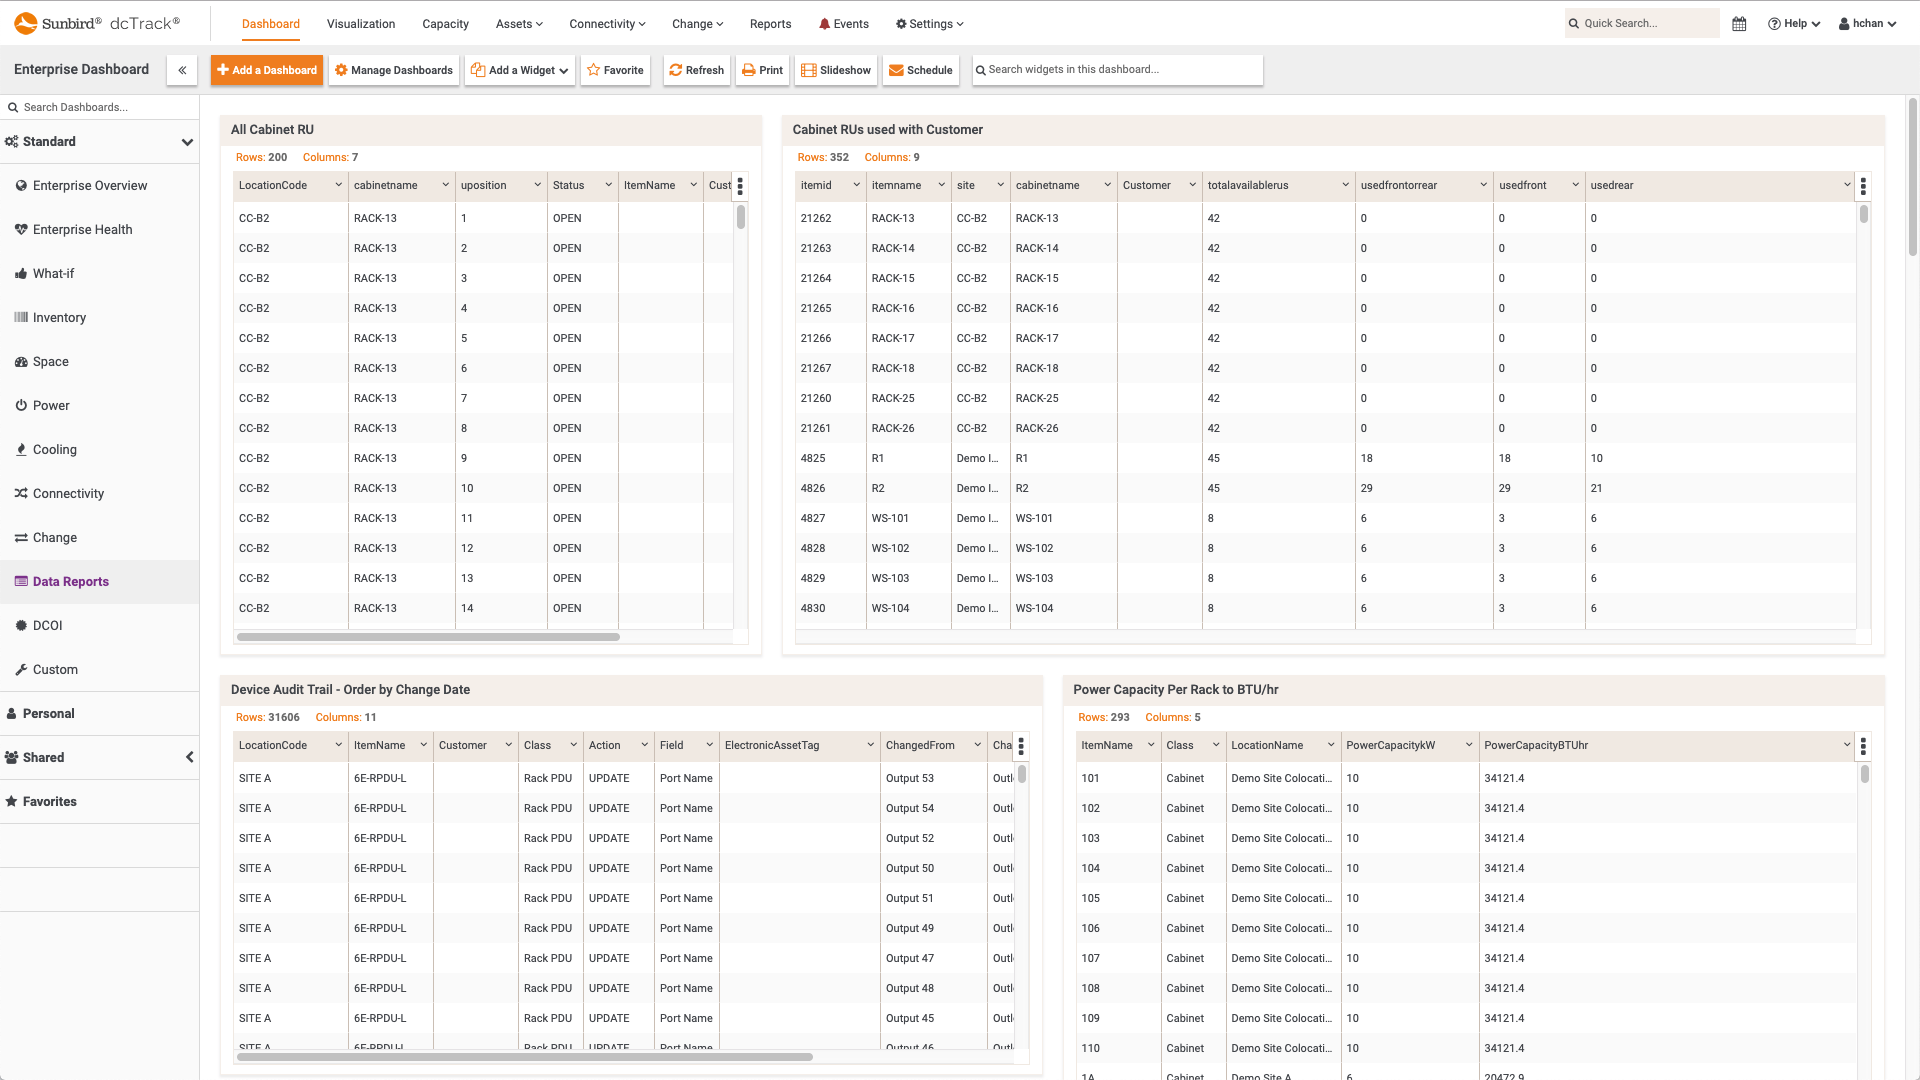
 dcTrack DCIM Operations | BI & Data Analytics | DashboardsUser Customizable SQL Report Widget
 -
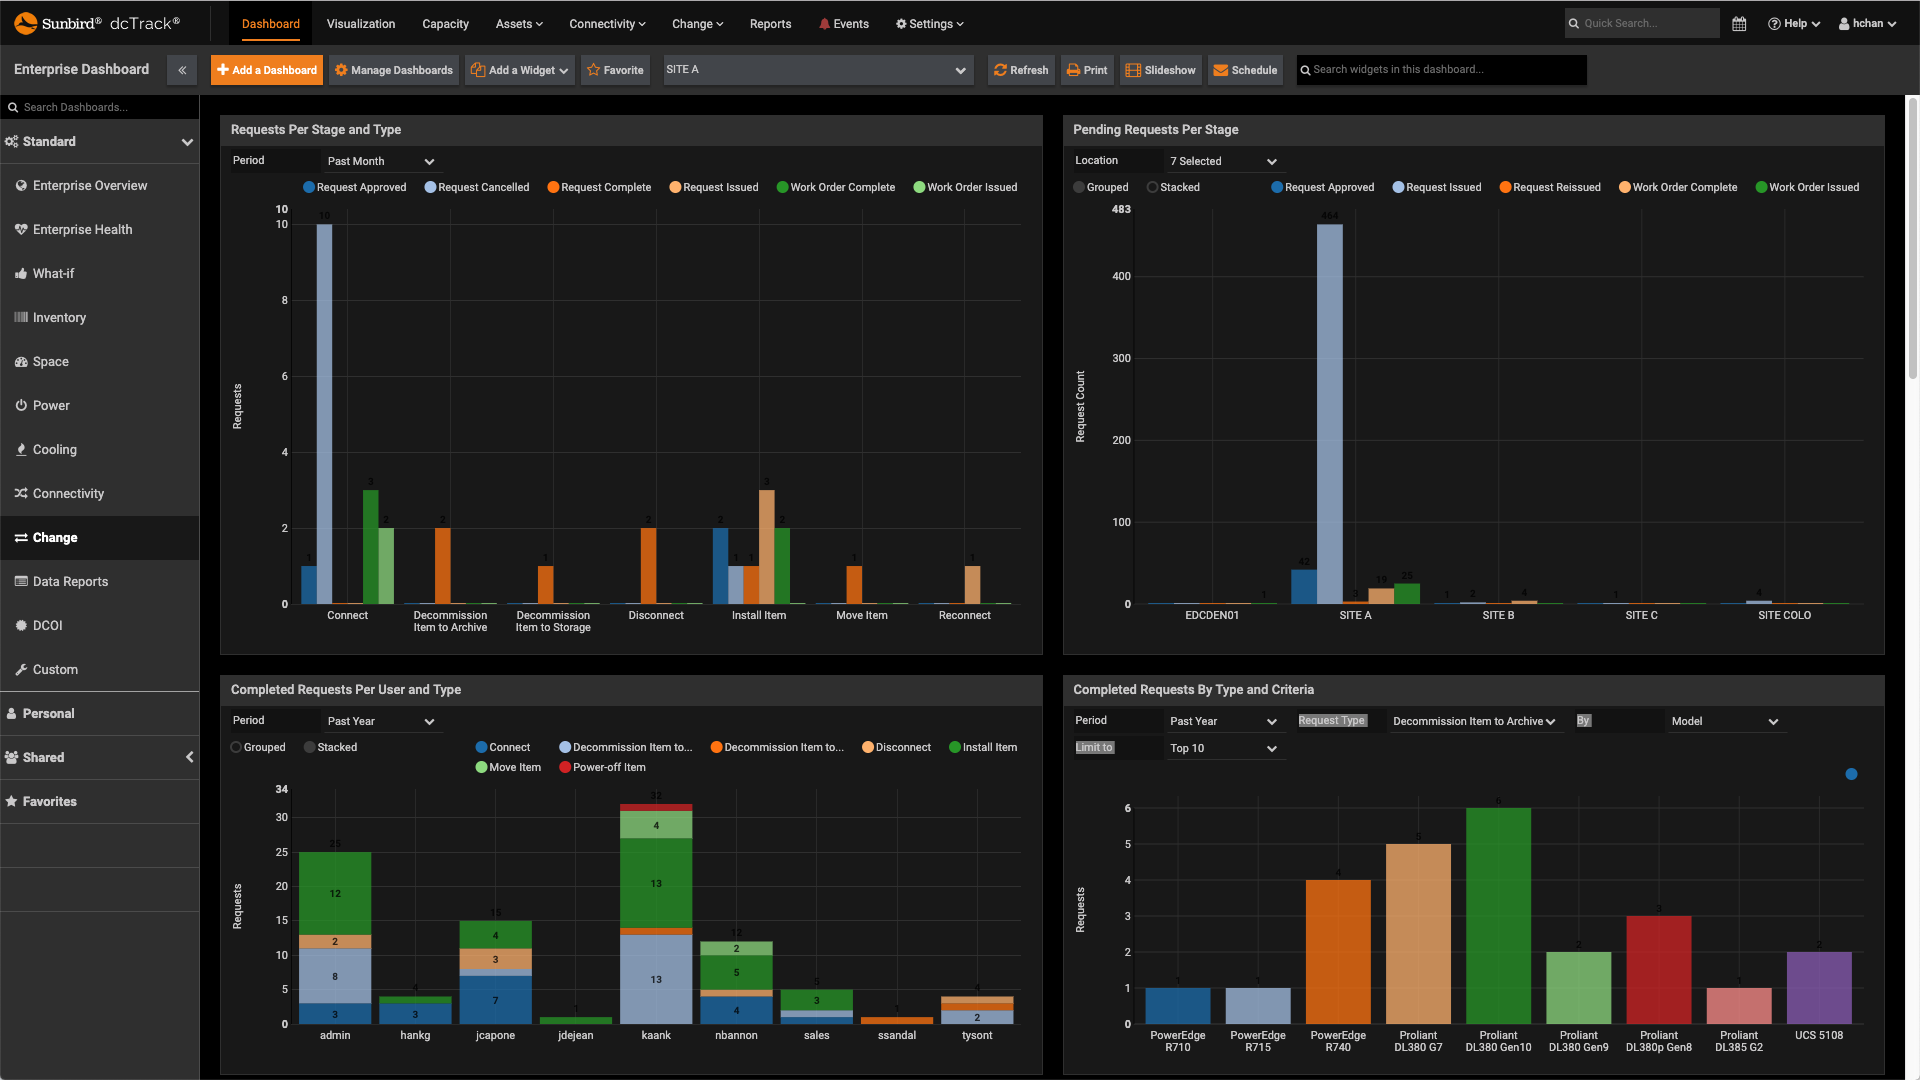
 dcTrack DCIM Operations | Change Management | BI & Data Analytics | DashboardsChange Dashboard
 -
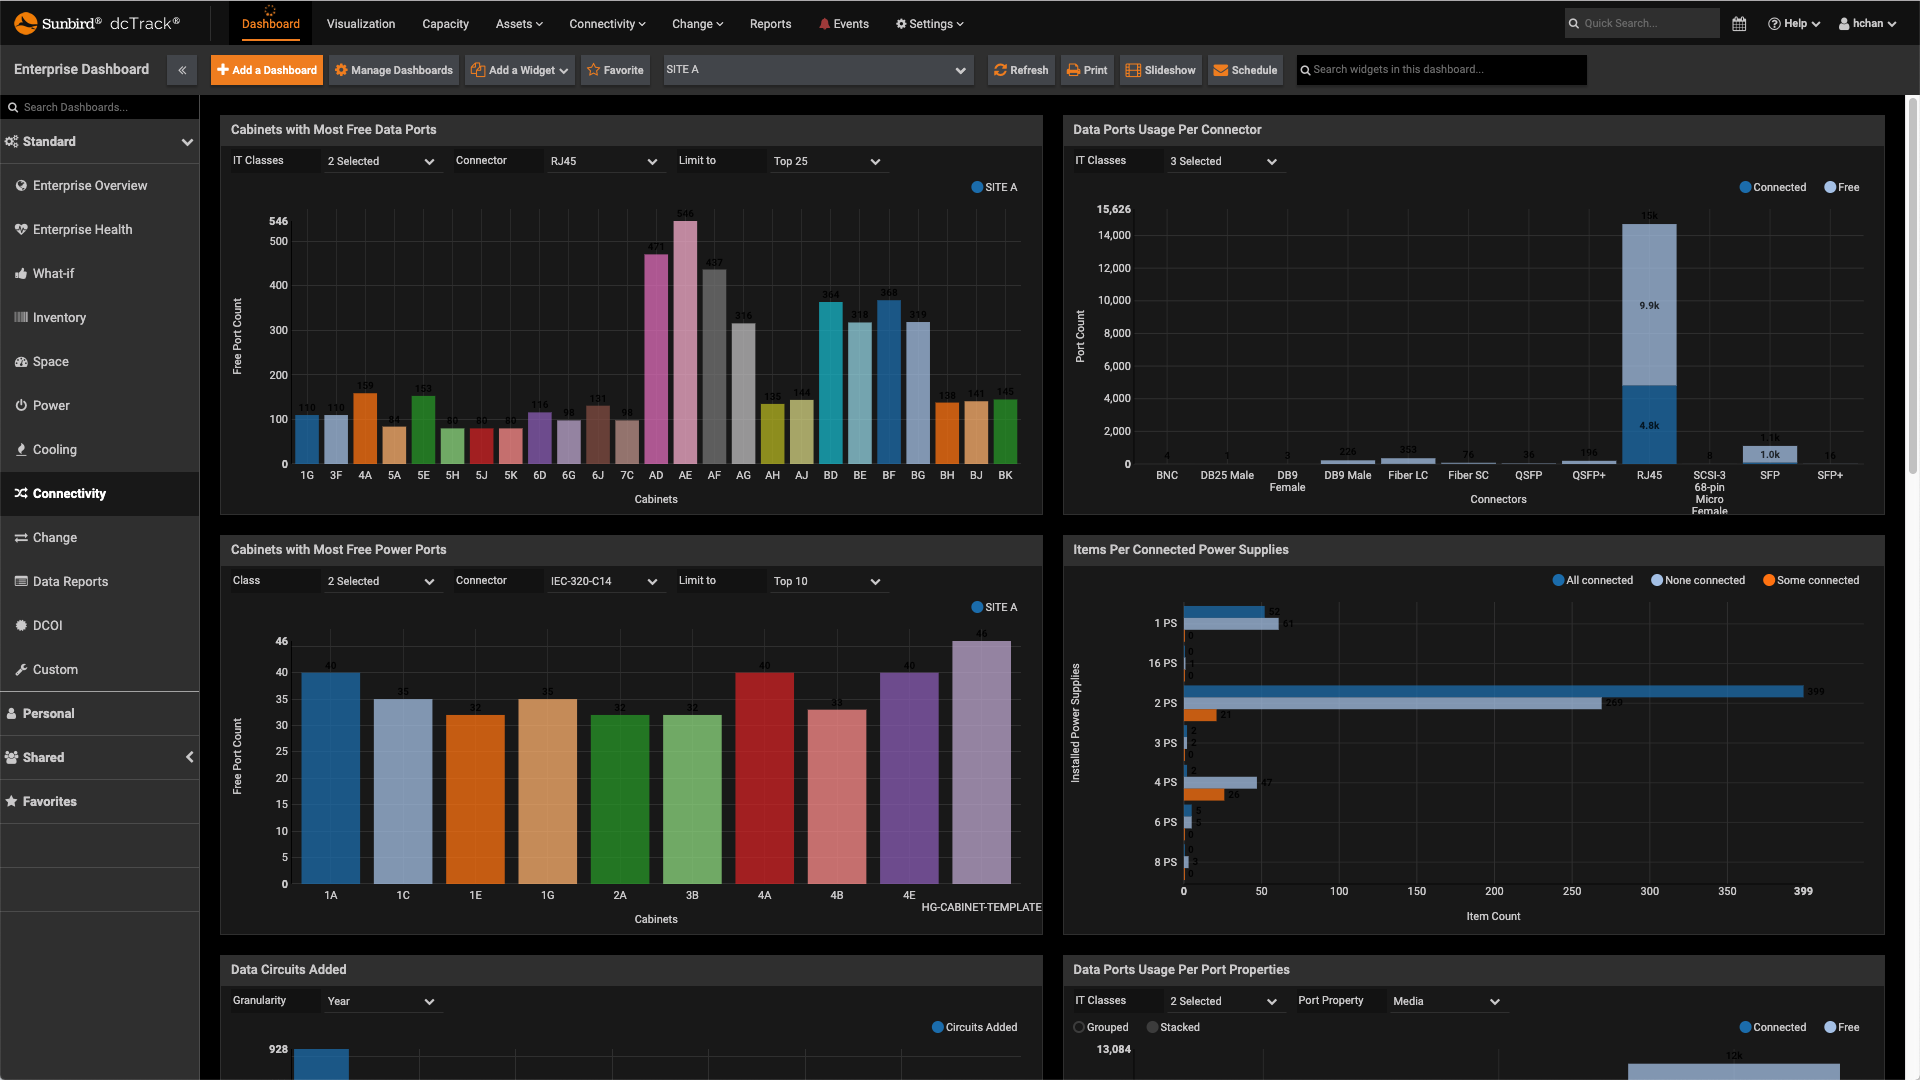
 dcTrack DCIM Operations | Connectivity Management | BI & Data Analytics | DashboardsConnectivity Dashboard
 -
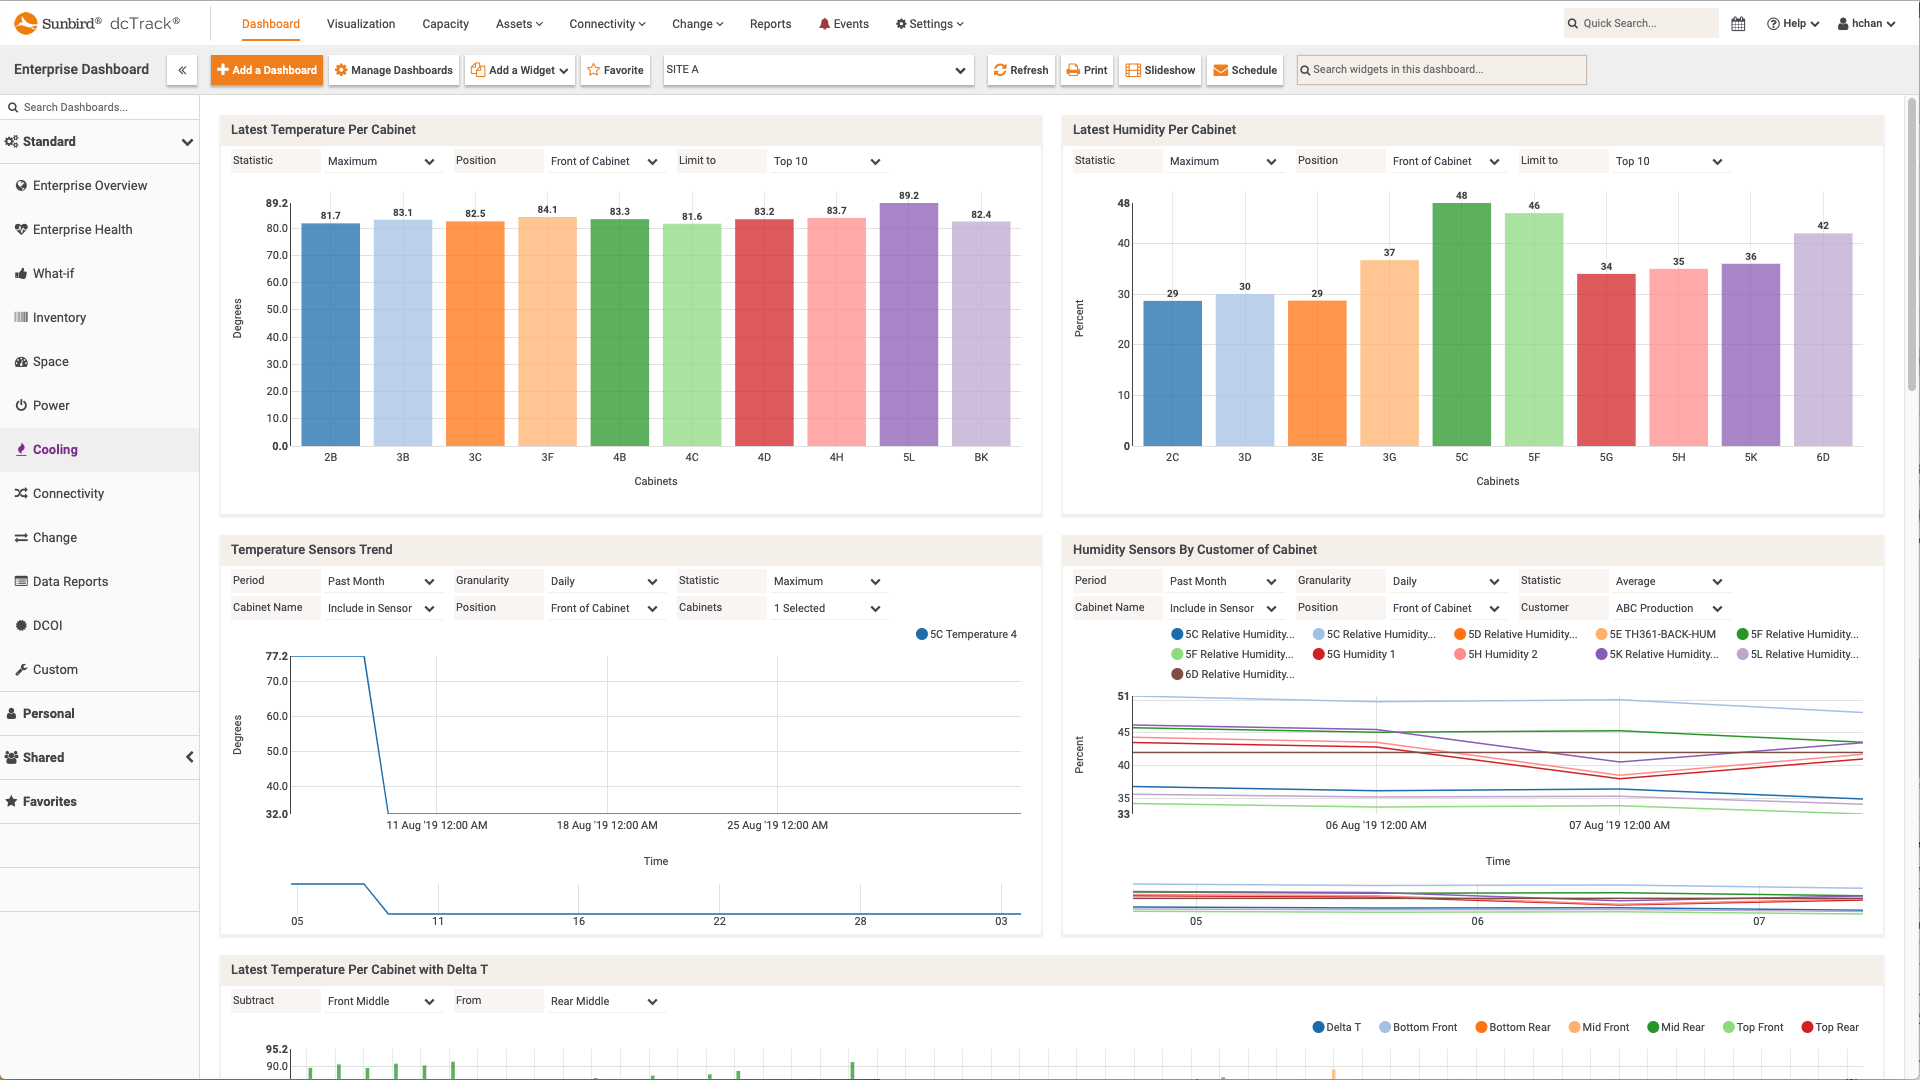
 dcTrack DCIM Operations | BI & Data Analytics | Environment Management | DashboardsEnvironment and Cooling Dashboard
 -
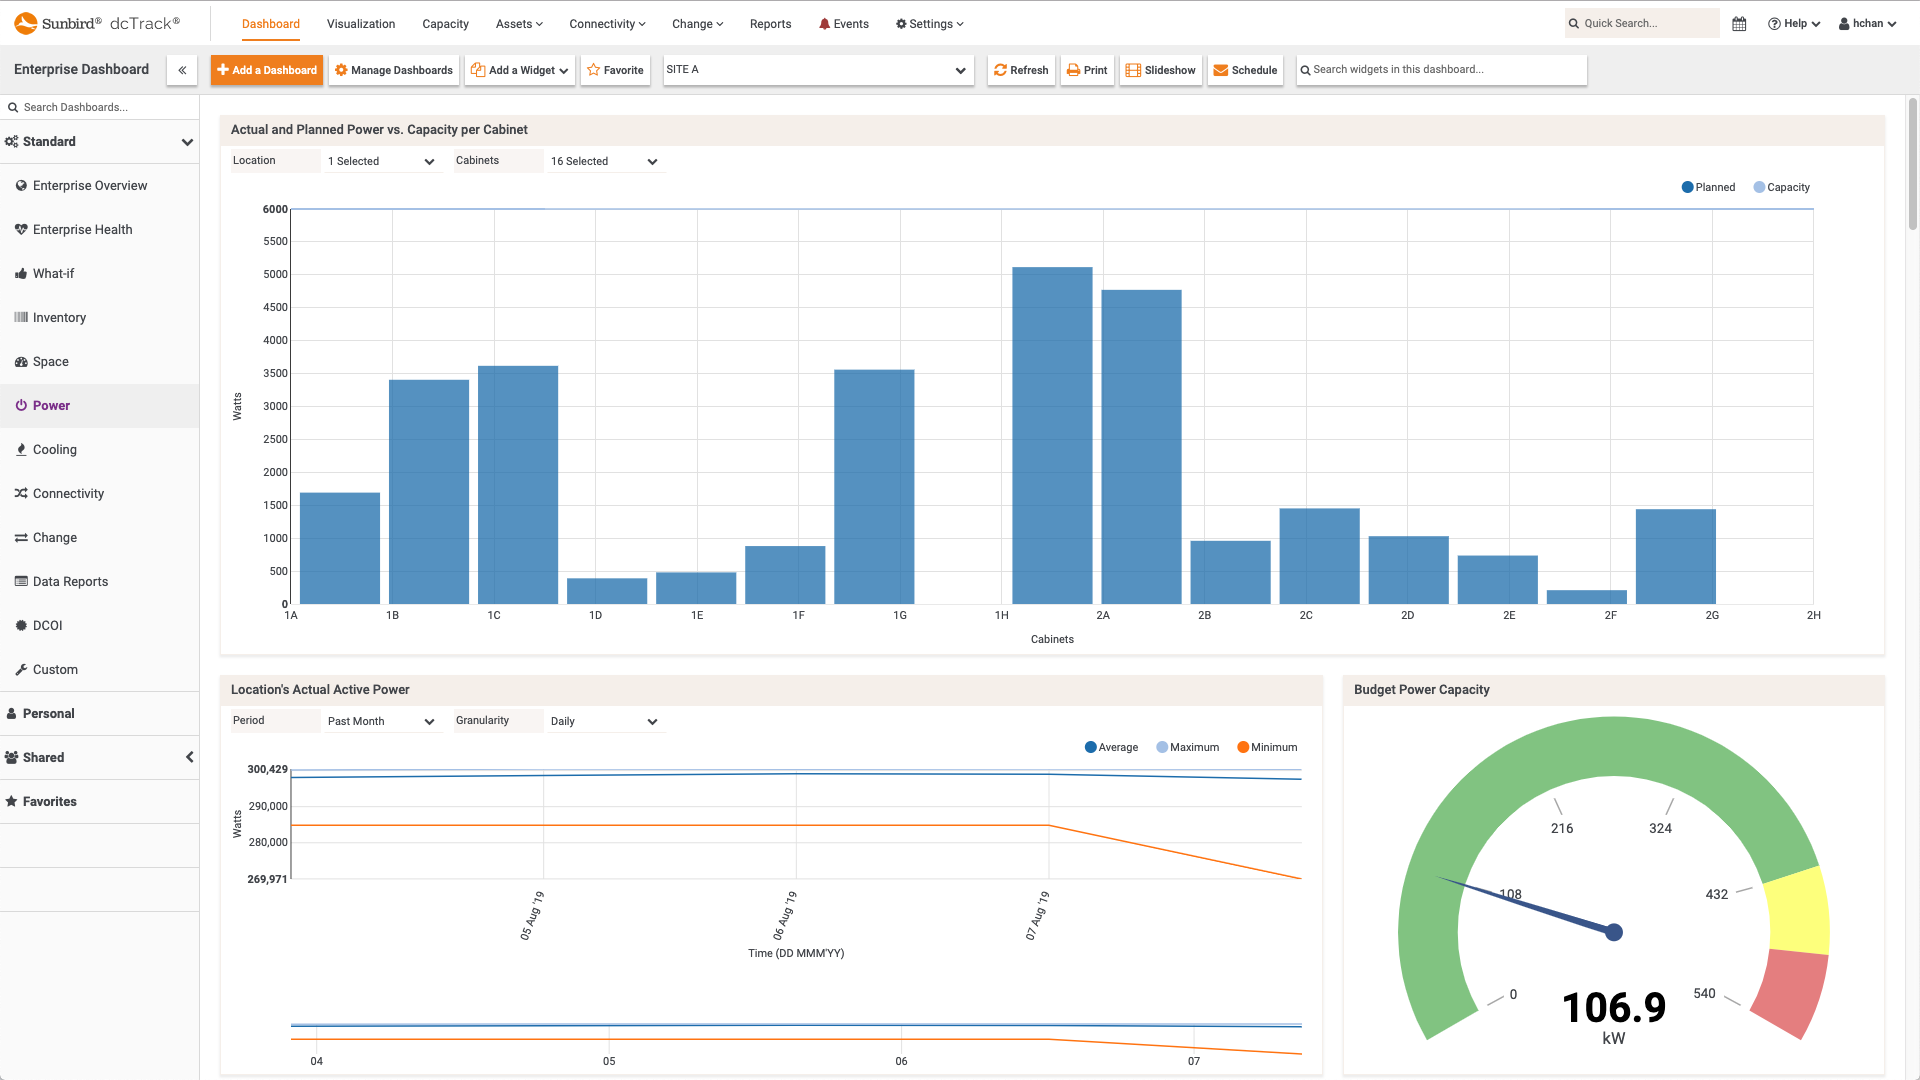
 dcTrack DCIM Operations | BI & Data Analytics | Power Management | DashboardsPower Dashboard
 -
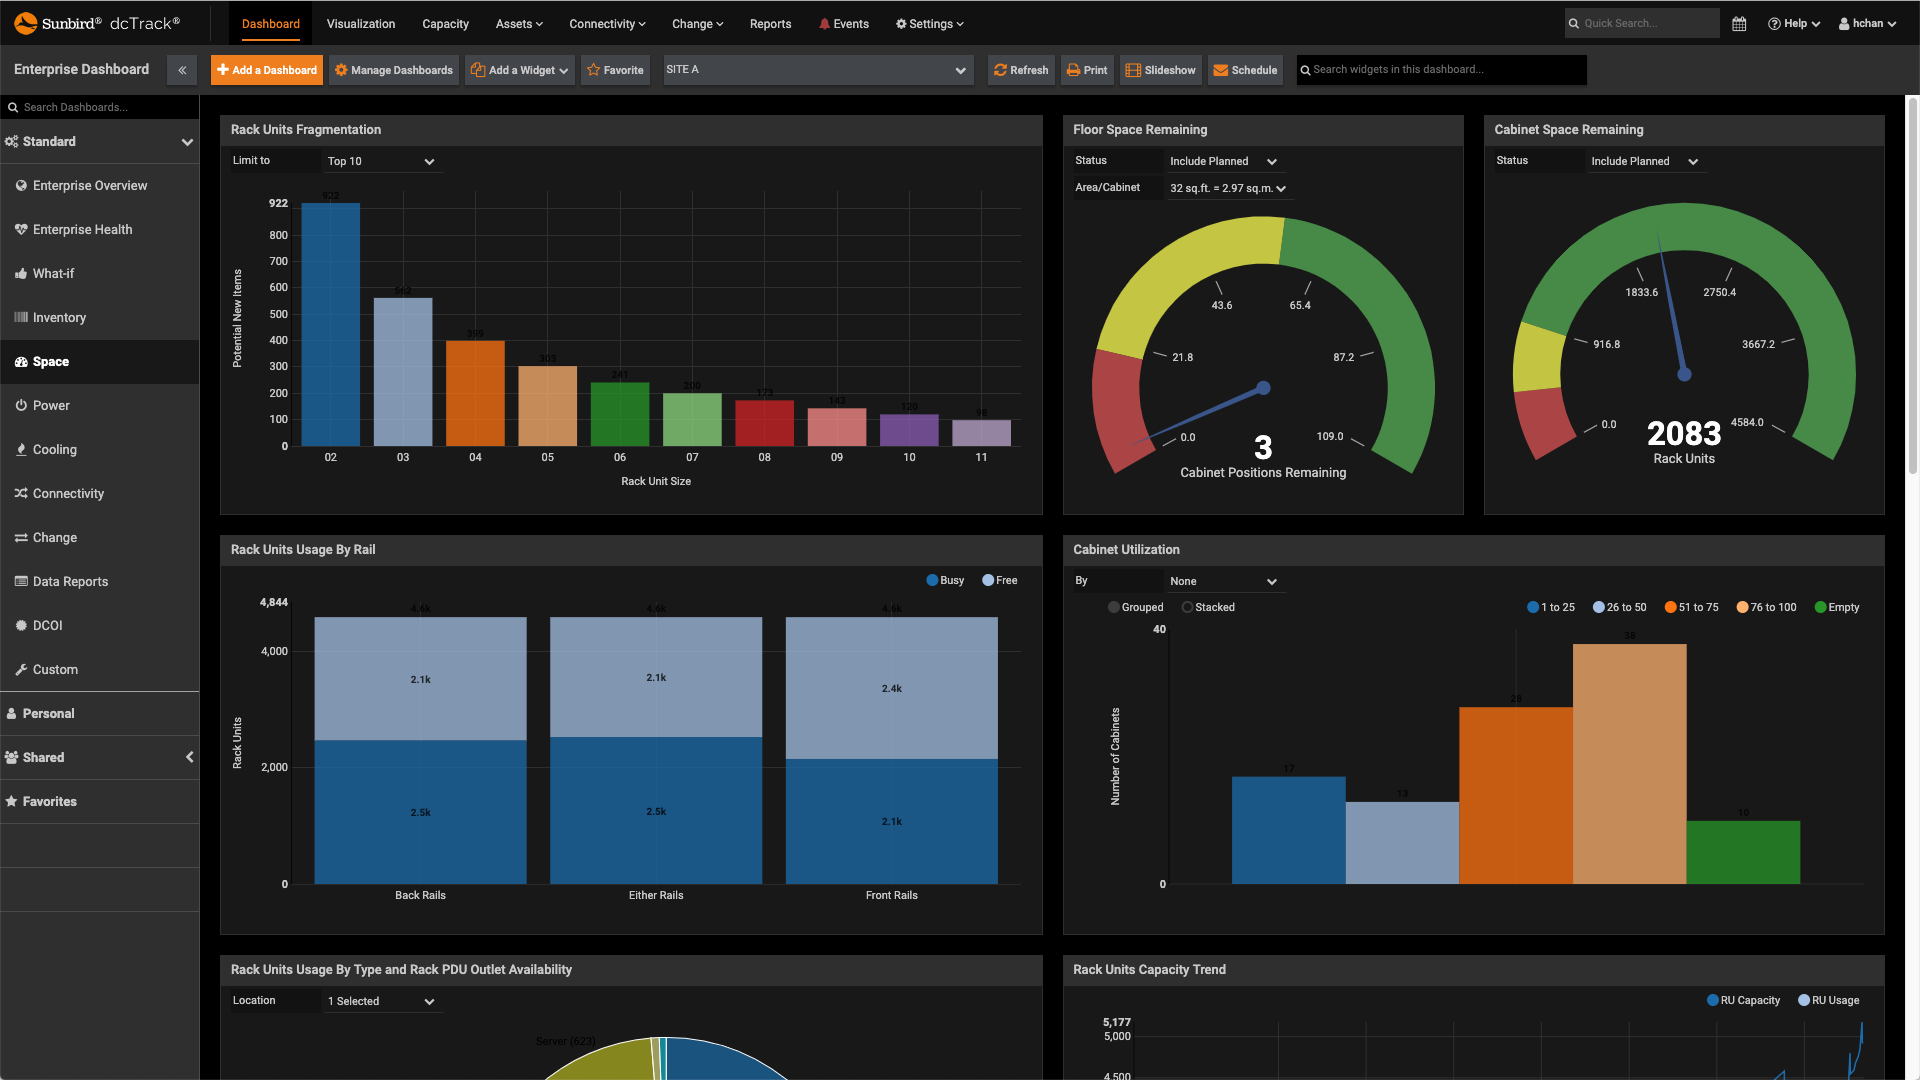
 dcTrack DCIM Operations | BI & Data Analytics | DashboardsSpace Dashboard
 -
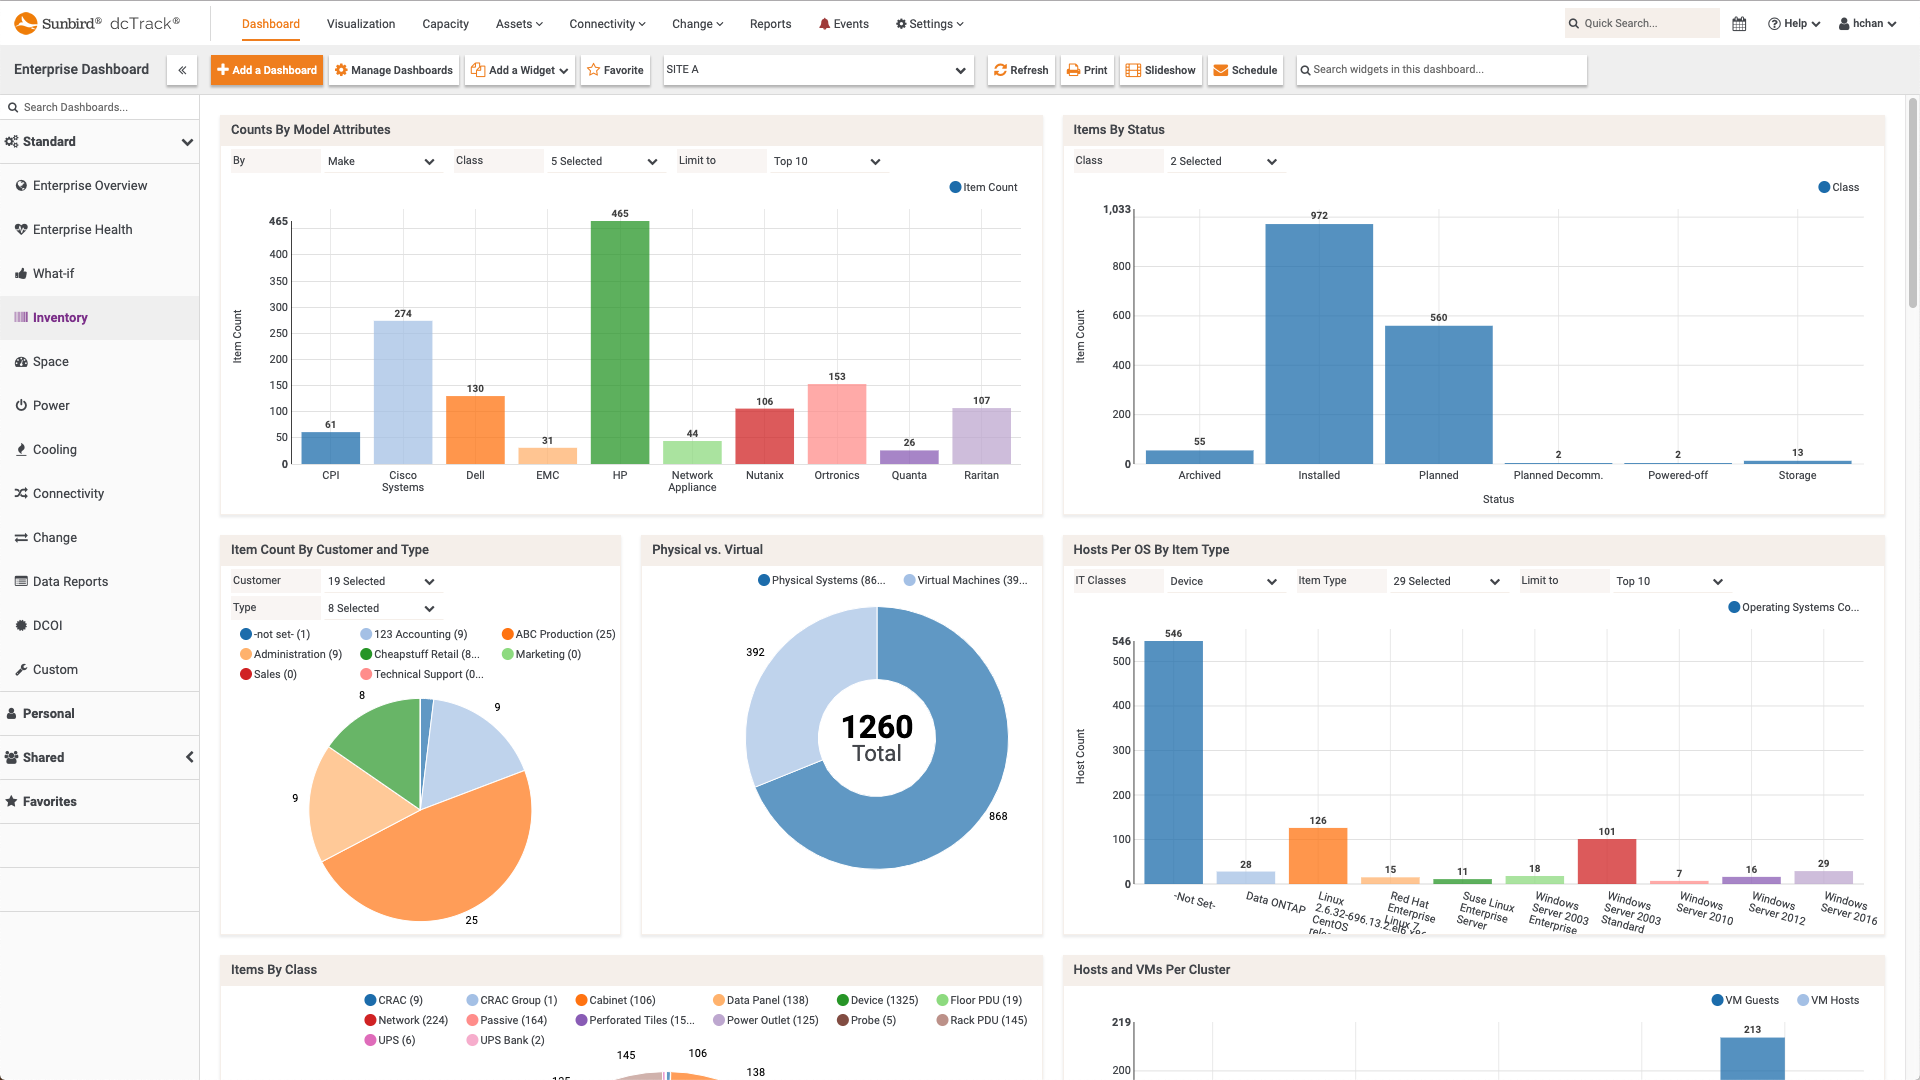
 dcTrack DCIM Operations | BI & Data Analytics | DashboardsInventory Dashboard
 -
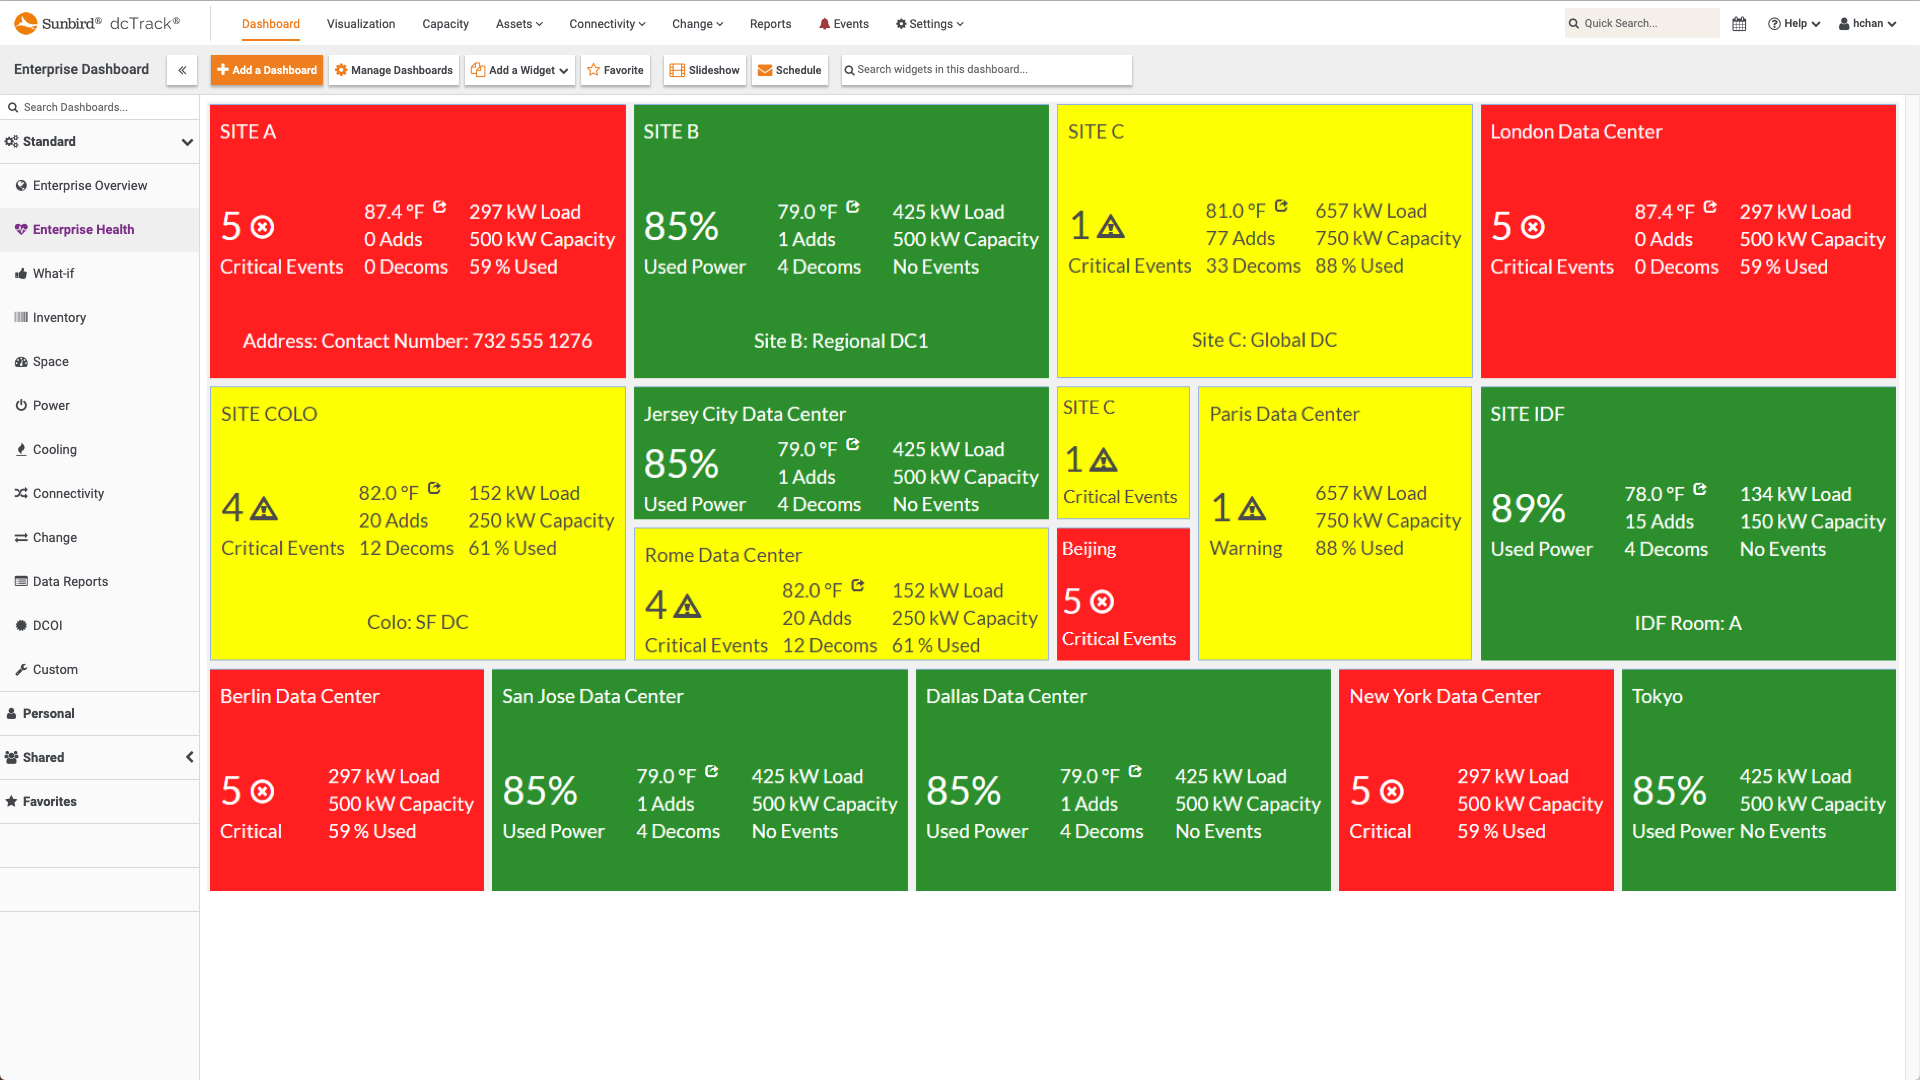
 dcTrack DCIM Operations | BI & Data Analytics | DashboardsEnterprise Health Dashboard
 -
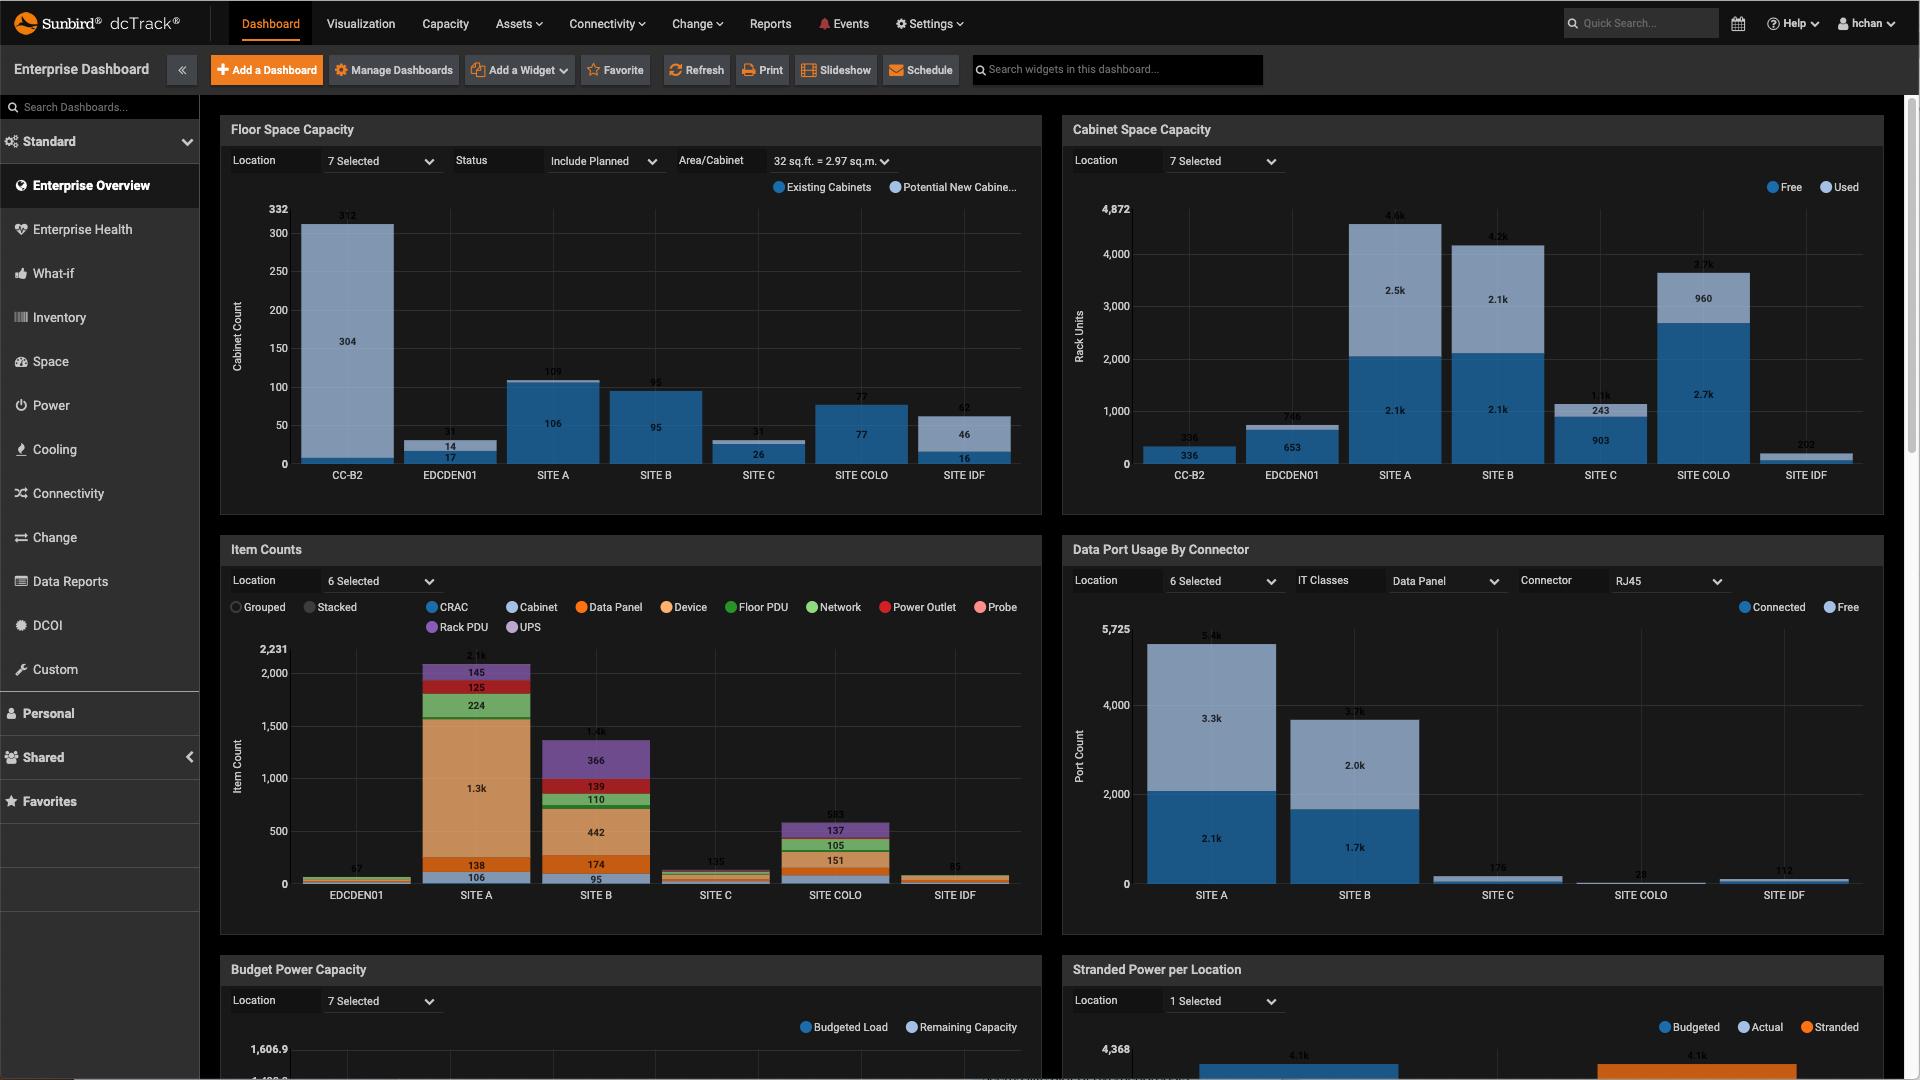
 dcTrack DCIM Operations | BI & Data Analytics | DashboardsMulti-Site Enterprise Overview Dashboard
 -
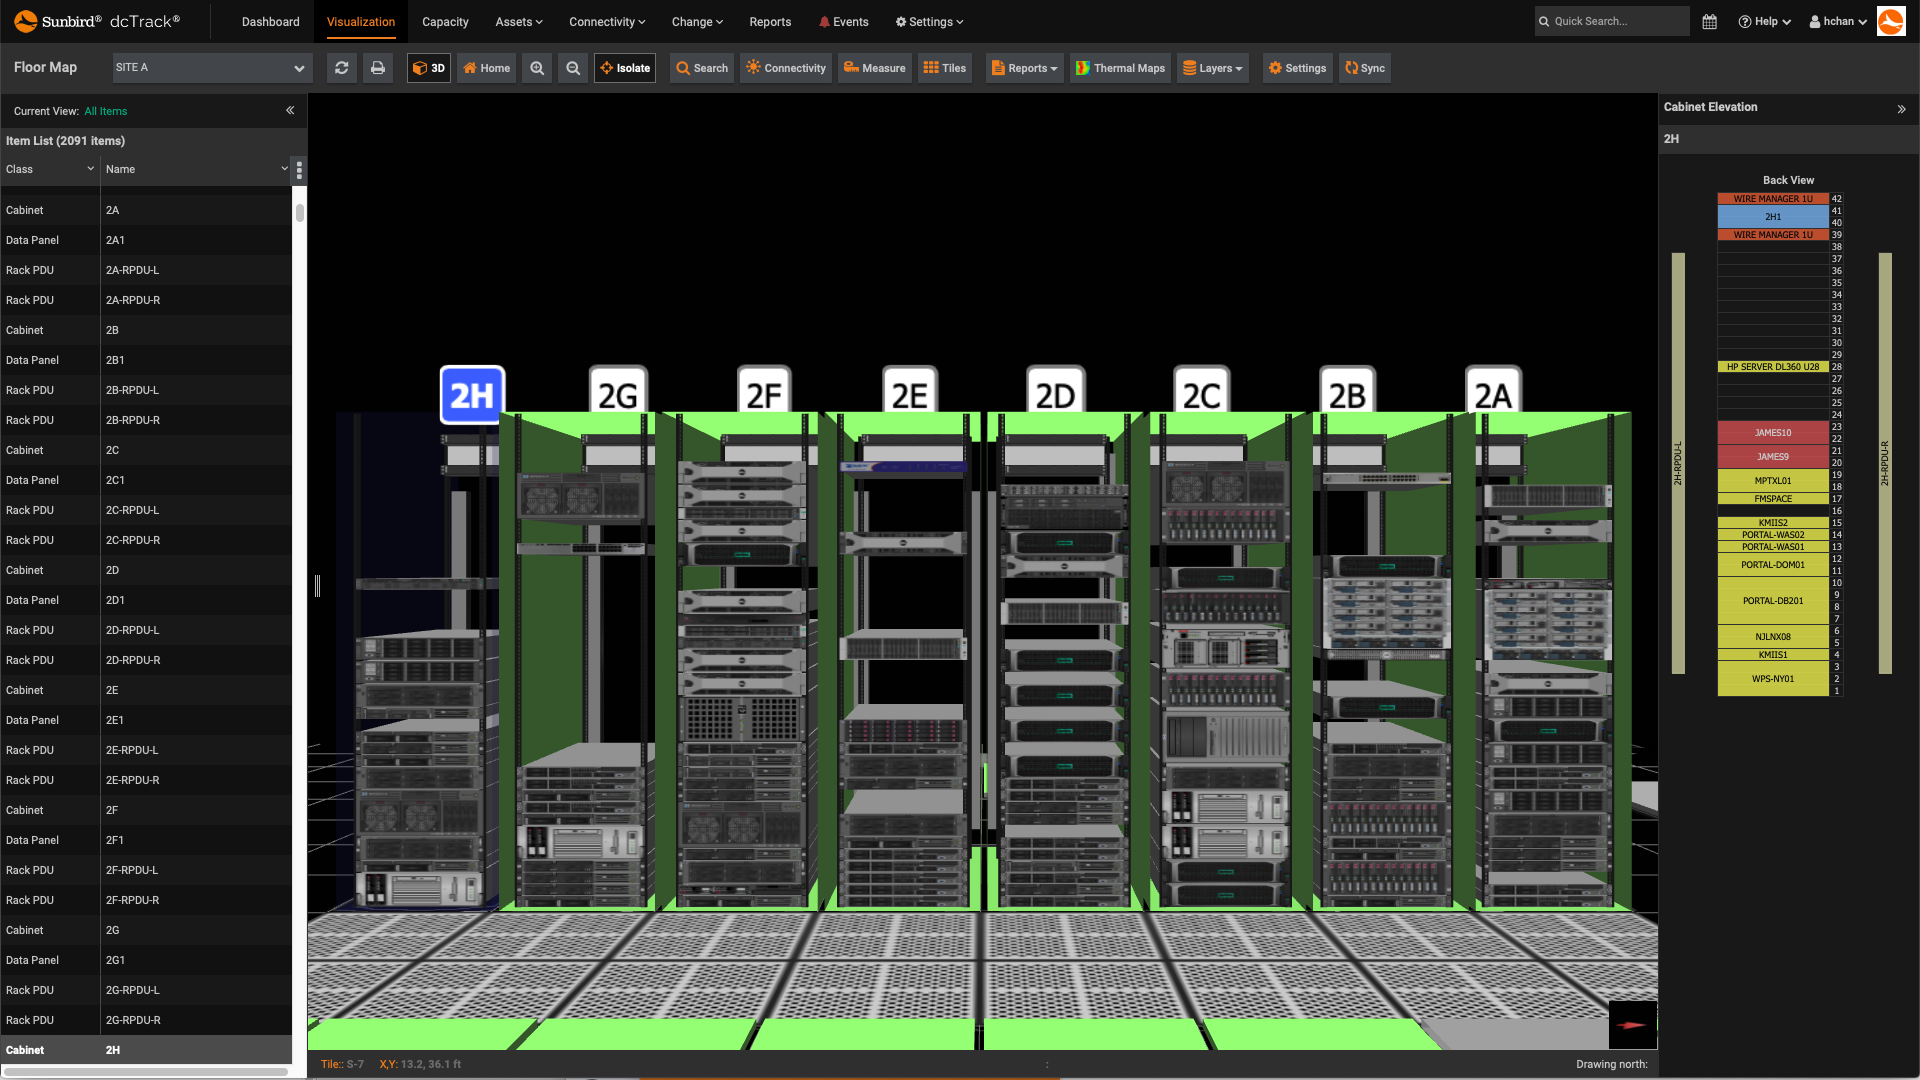
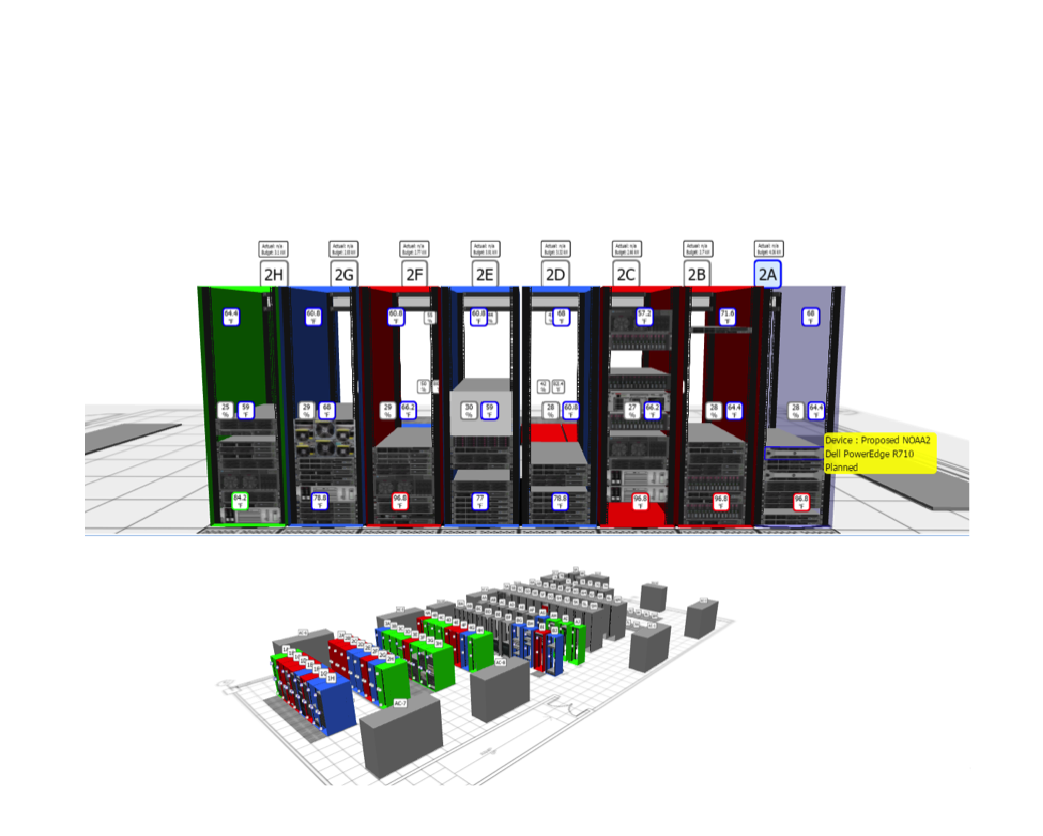
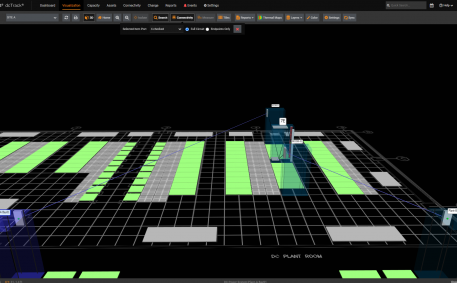
 dcTrack DCIM Operations | Visualization3D Visualization
 -
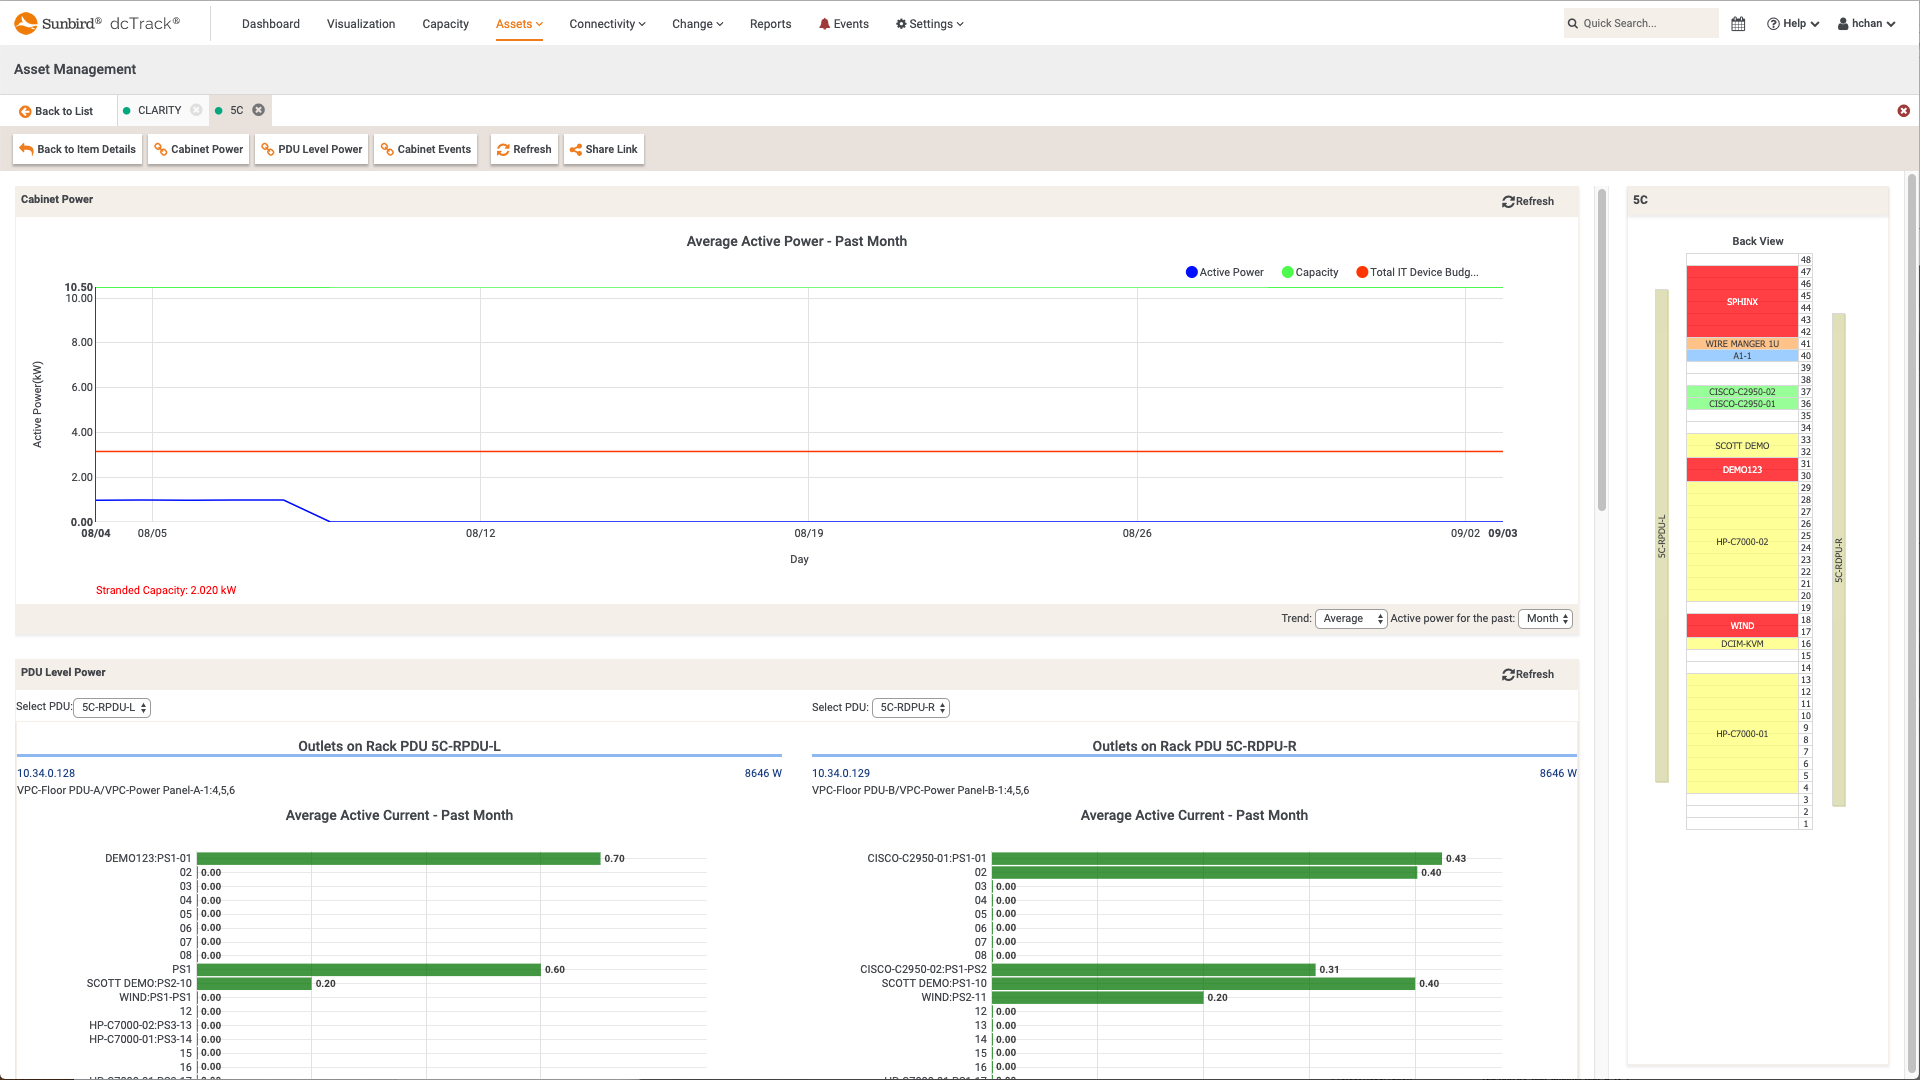
 dcTrack DCIM Operations | Power Management | Capacity ManagementCabinet Level Power Usage Trends at Inlet, Breaker, and Outlet Levels
 -
 dcTrack DCIM Operations | Asset ManagementPaperless Audit Mobile App
 -
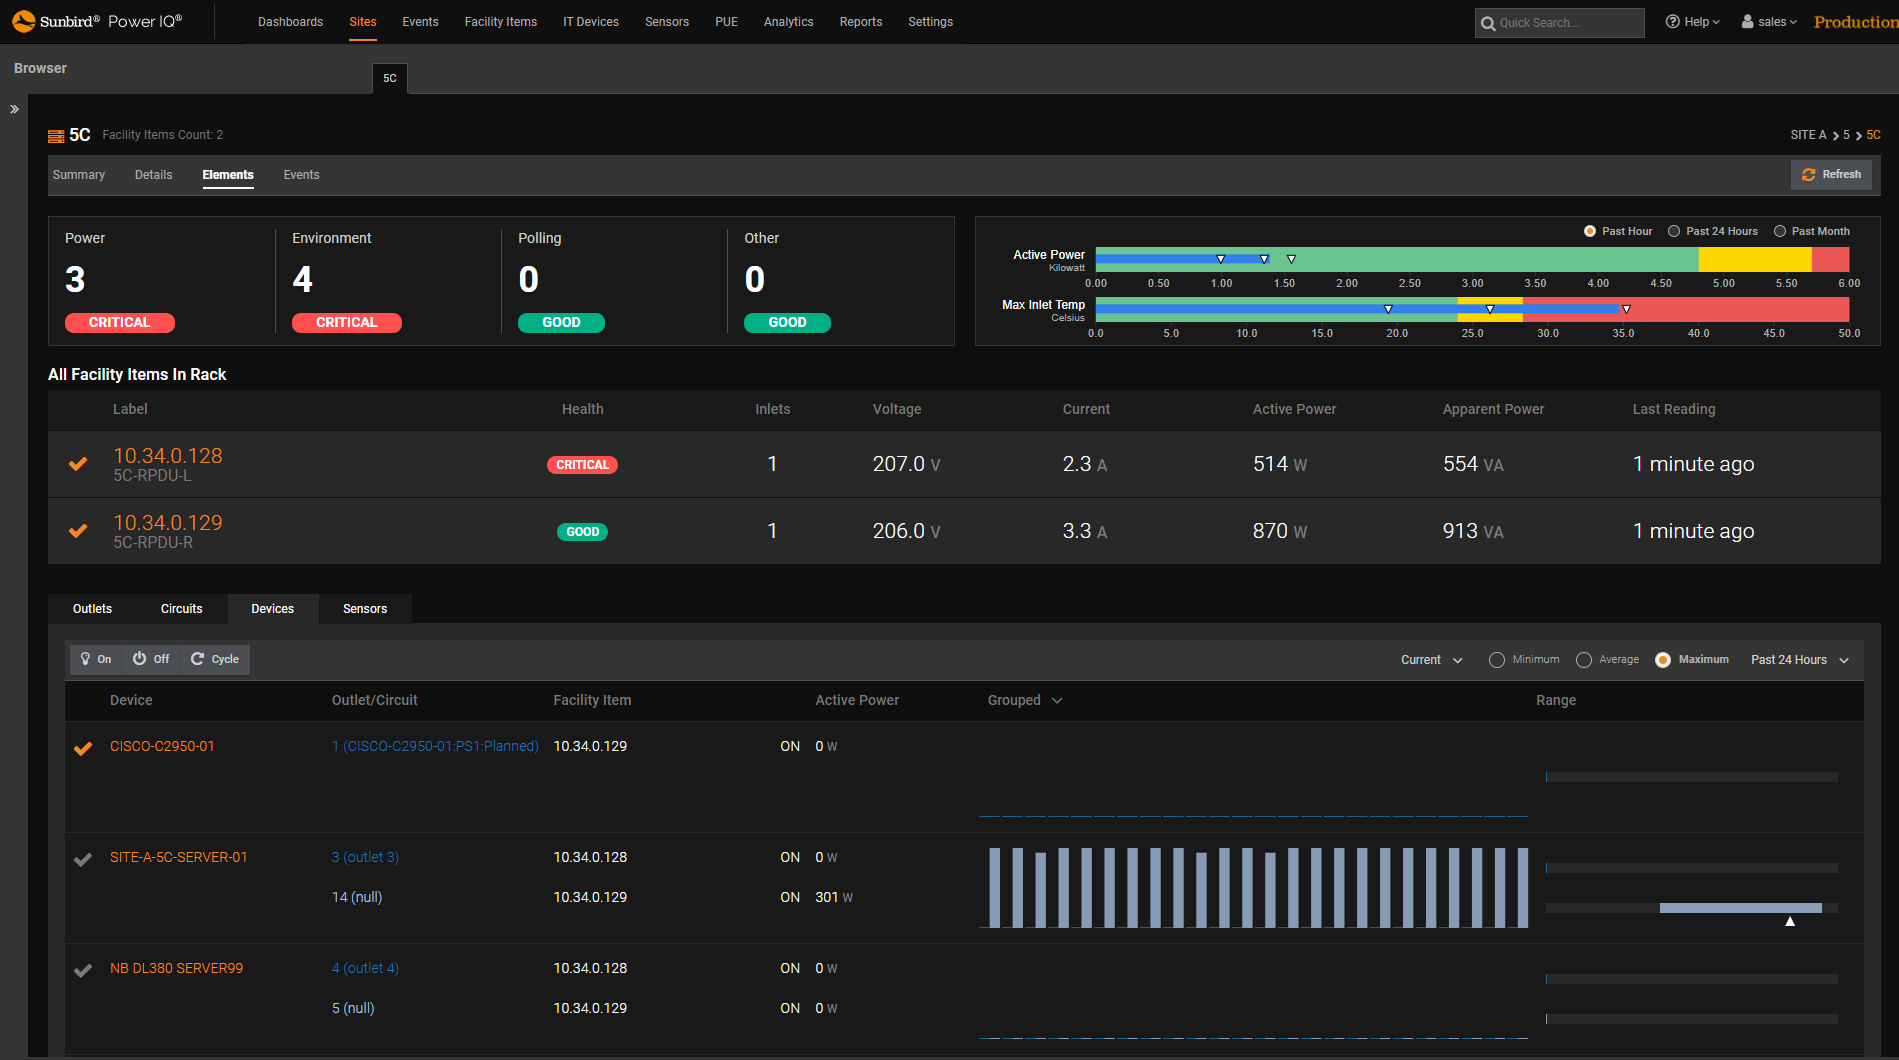
 Power IQ DCIM Monitoring | Power ManagementDevice-Level Visual Analytics
 -
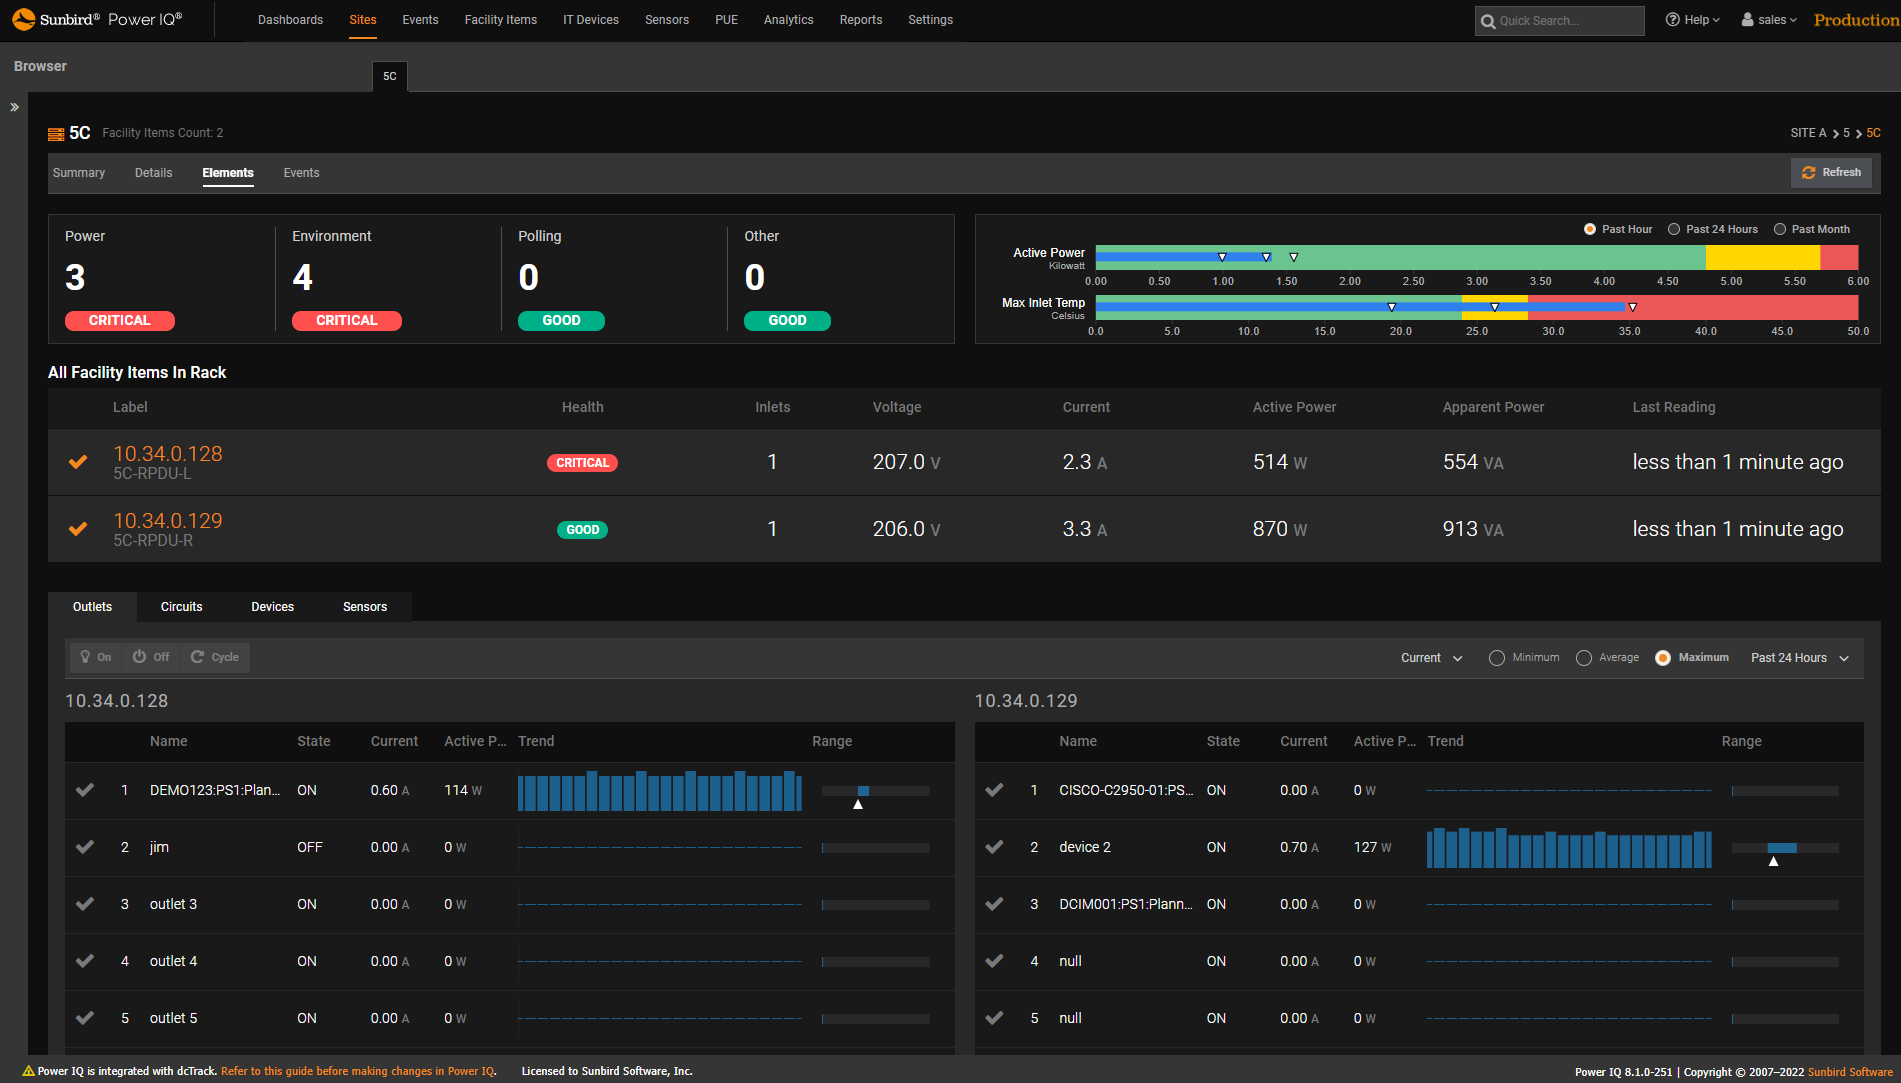
 Power IQ DCIM Monitoring | Power ManagementOutlet-Level Visual Analytics
 -
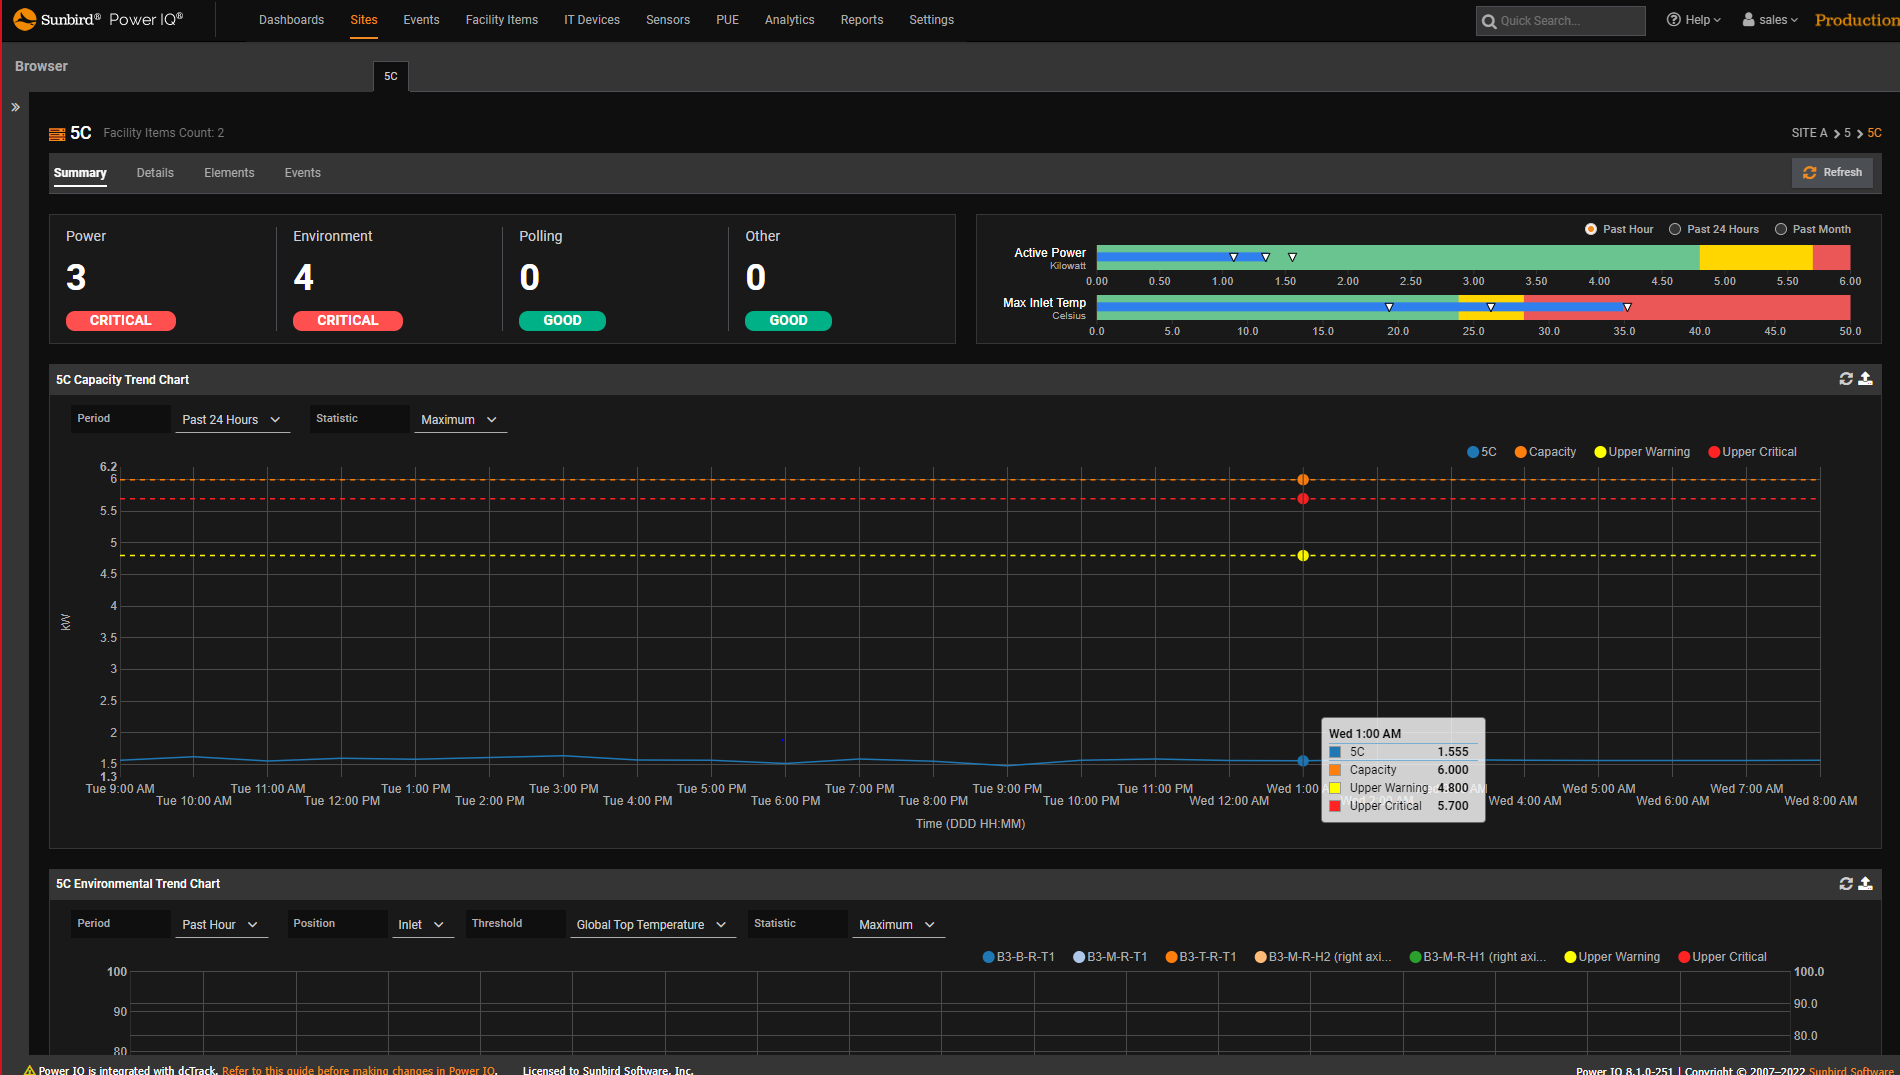
 Power IQ DCIM Monitoring | Power Management | Capacity Management | BI & Data AnalyticsRack-Level Visual Analytics
 -
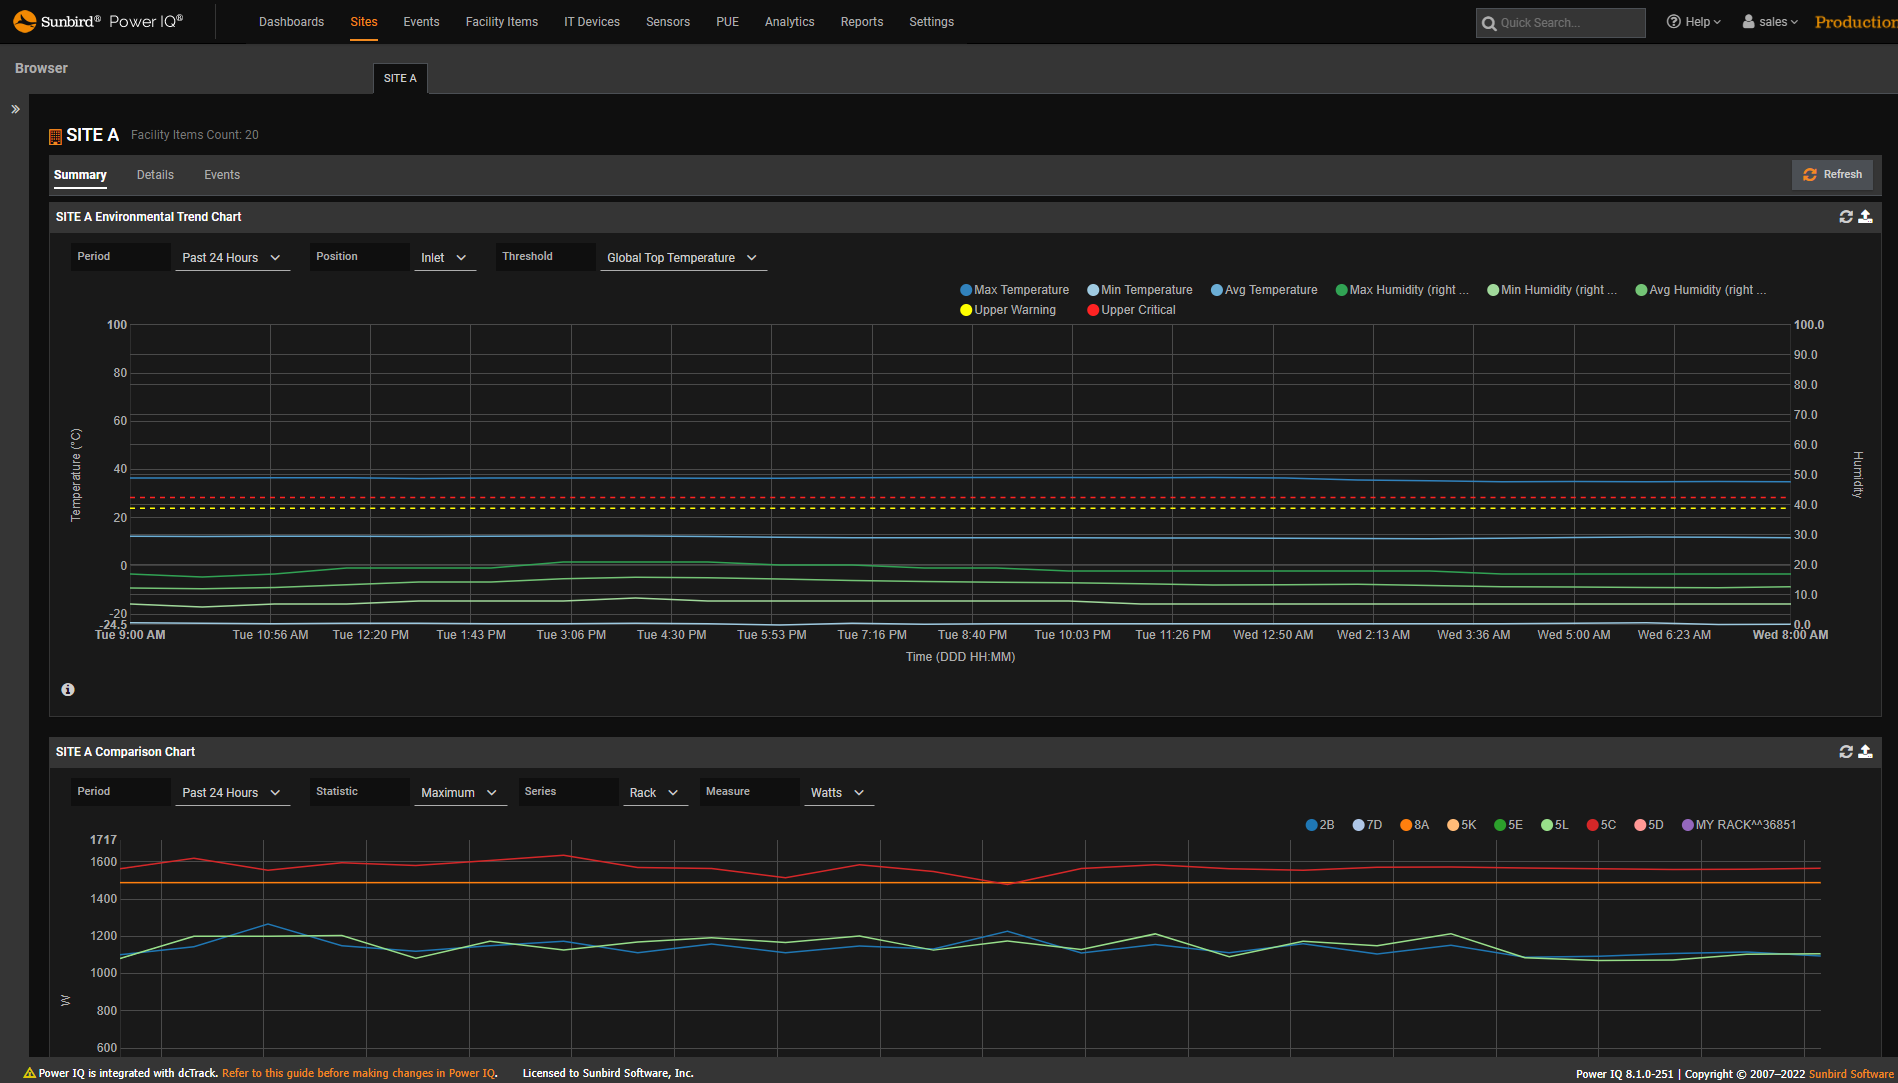
 Power IQ DCIM Monitoring | Environment Management | BI & Data AnalyticsEnvironmental Analytics
 -
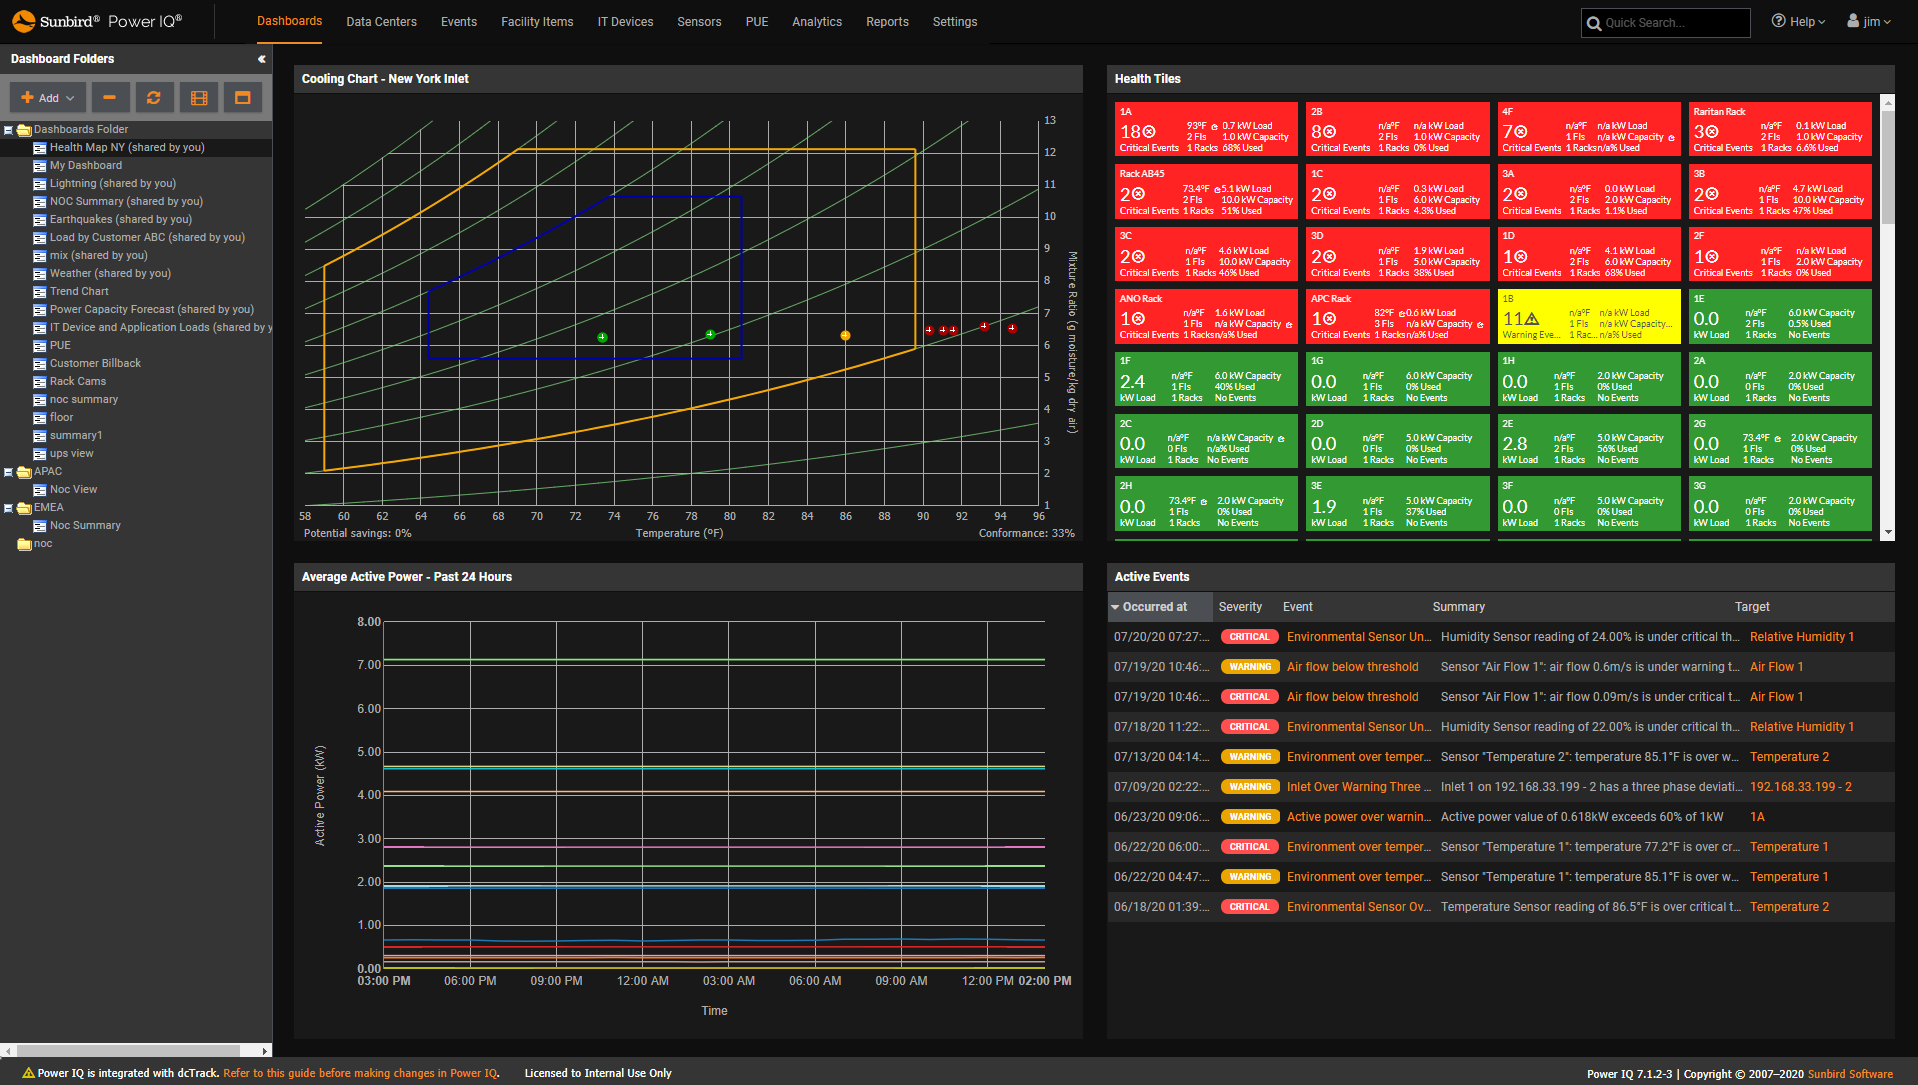
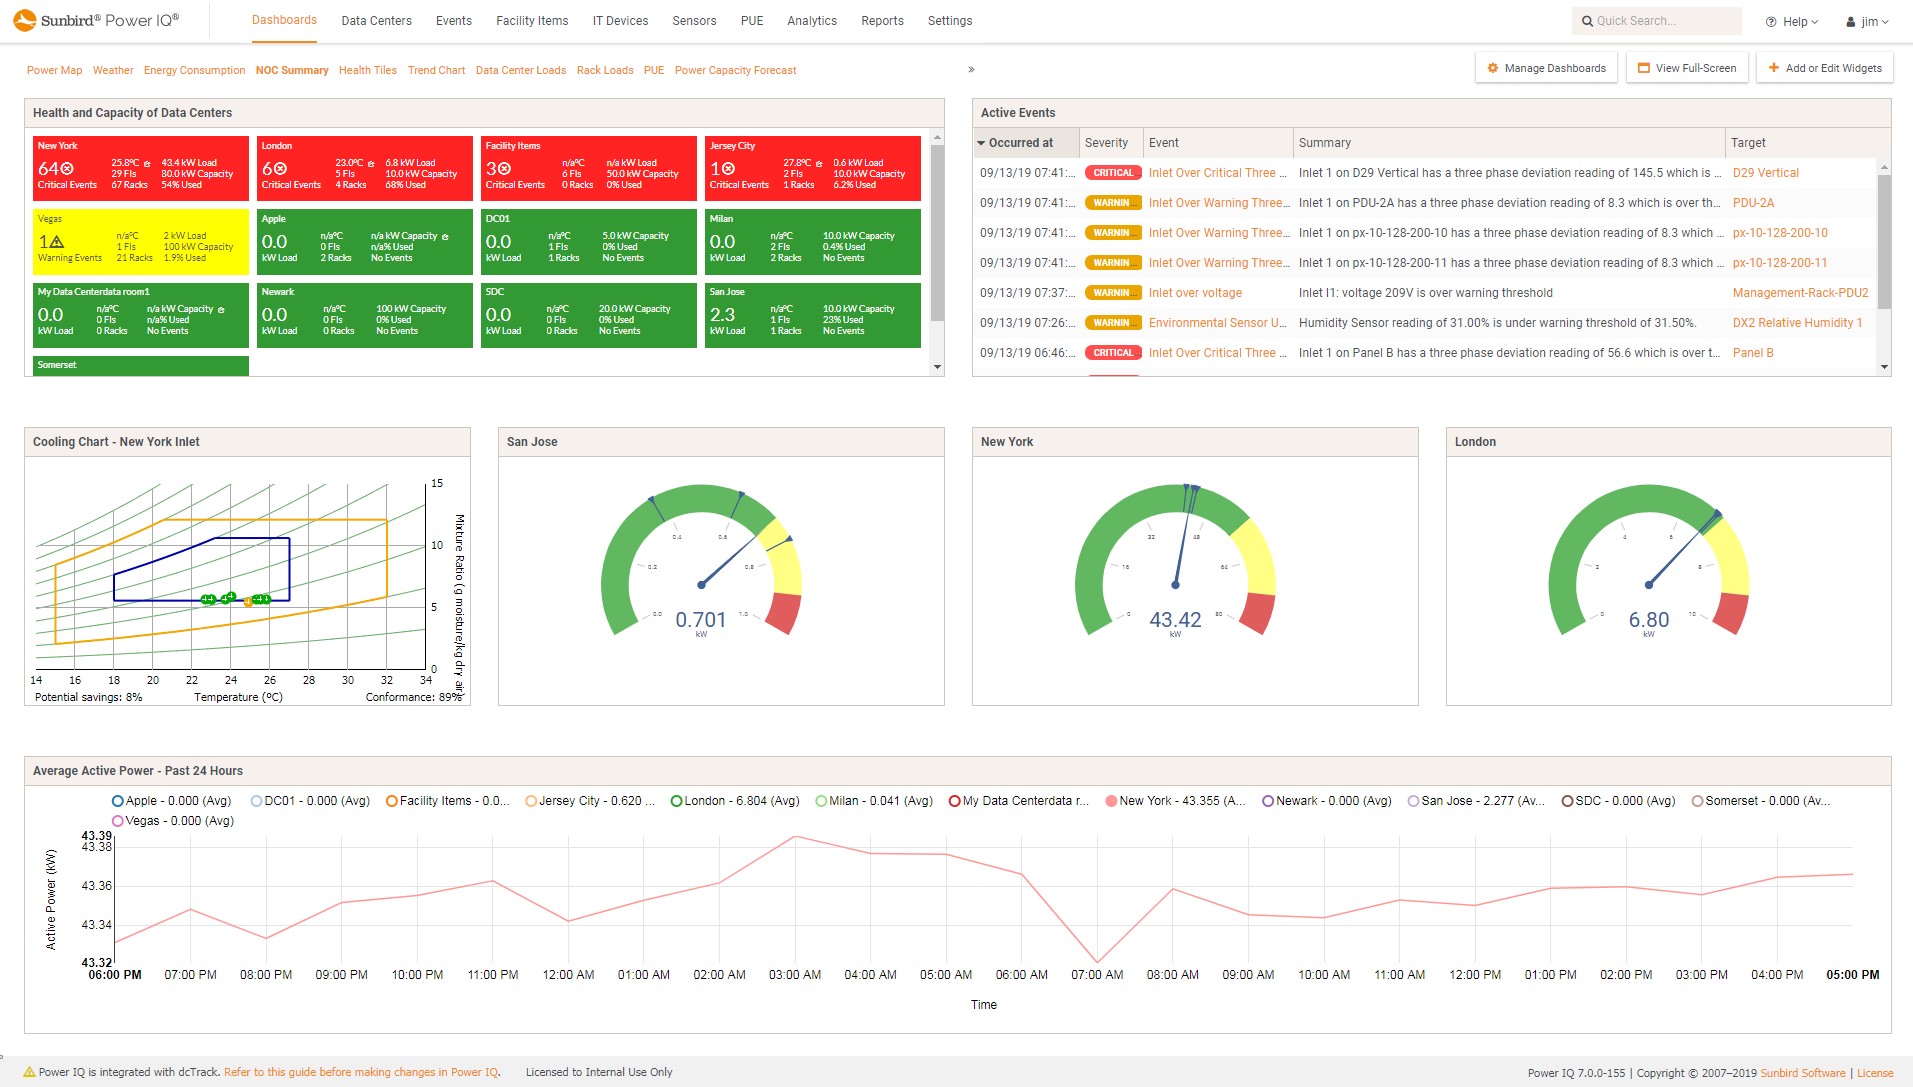
 Power IQ DCIM Monitoring | Power Management | Environment Management | BI & Data AnalyticsNOC Dashboard
 -
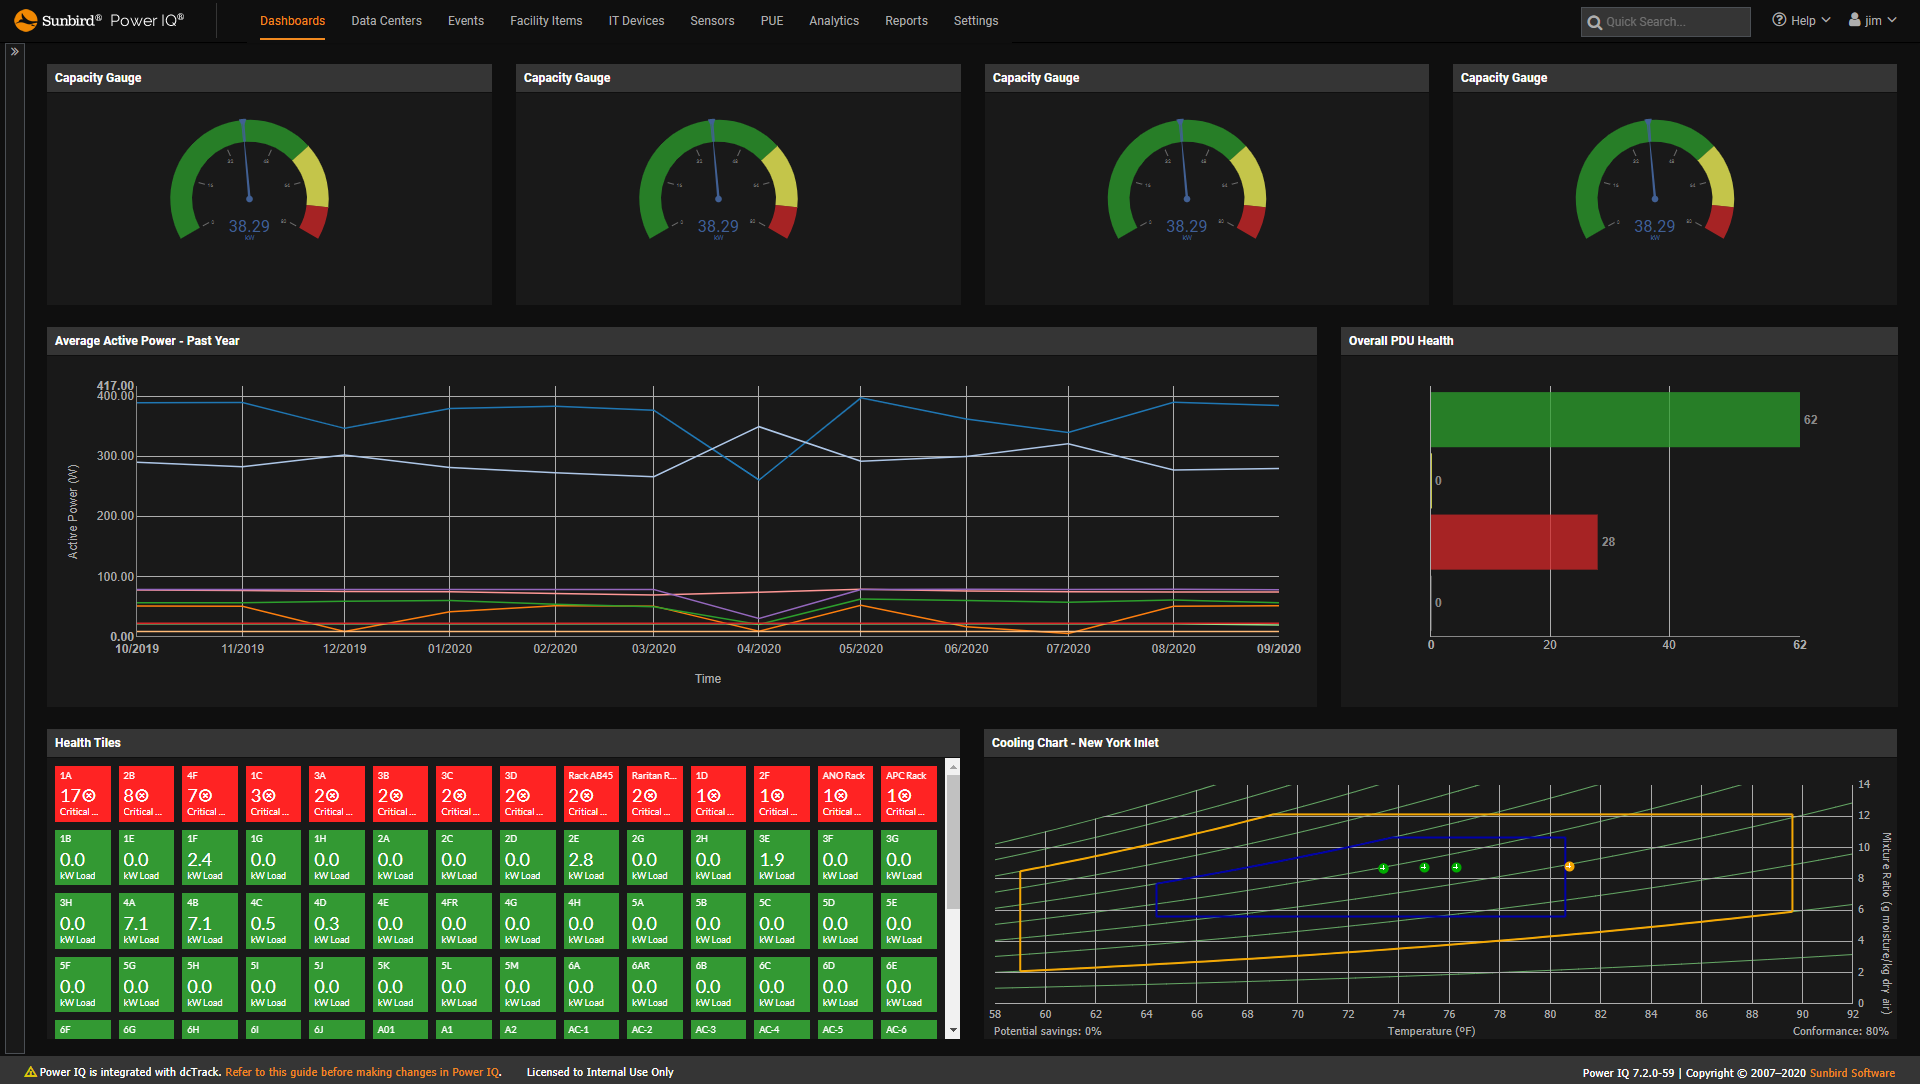
 Power IQ DCIM Monitoring | Dashboards | Power ManagementHealth and Capacity Widgets - Dark Mode
 -
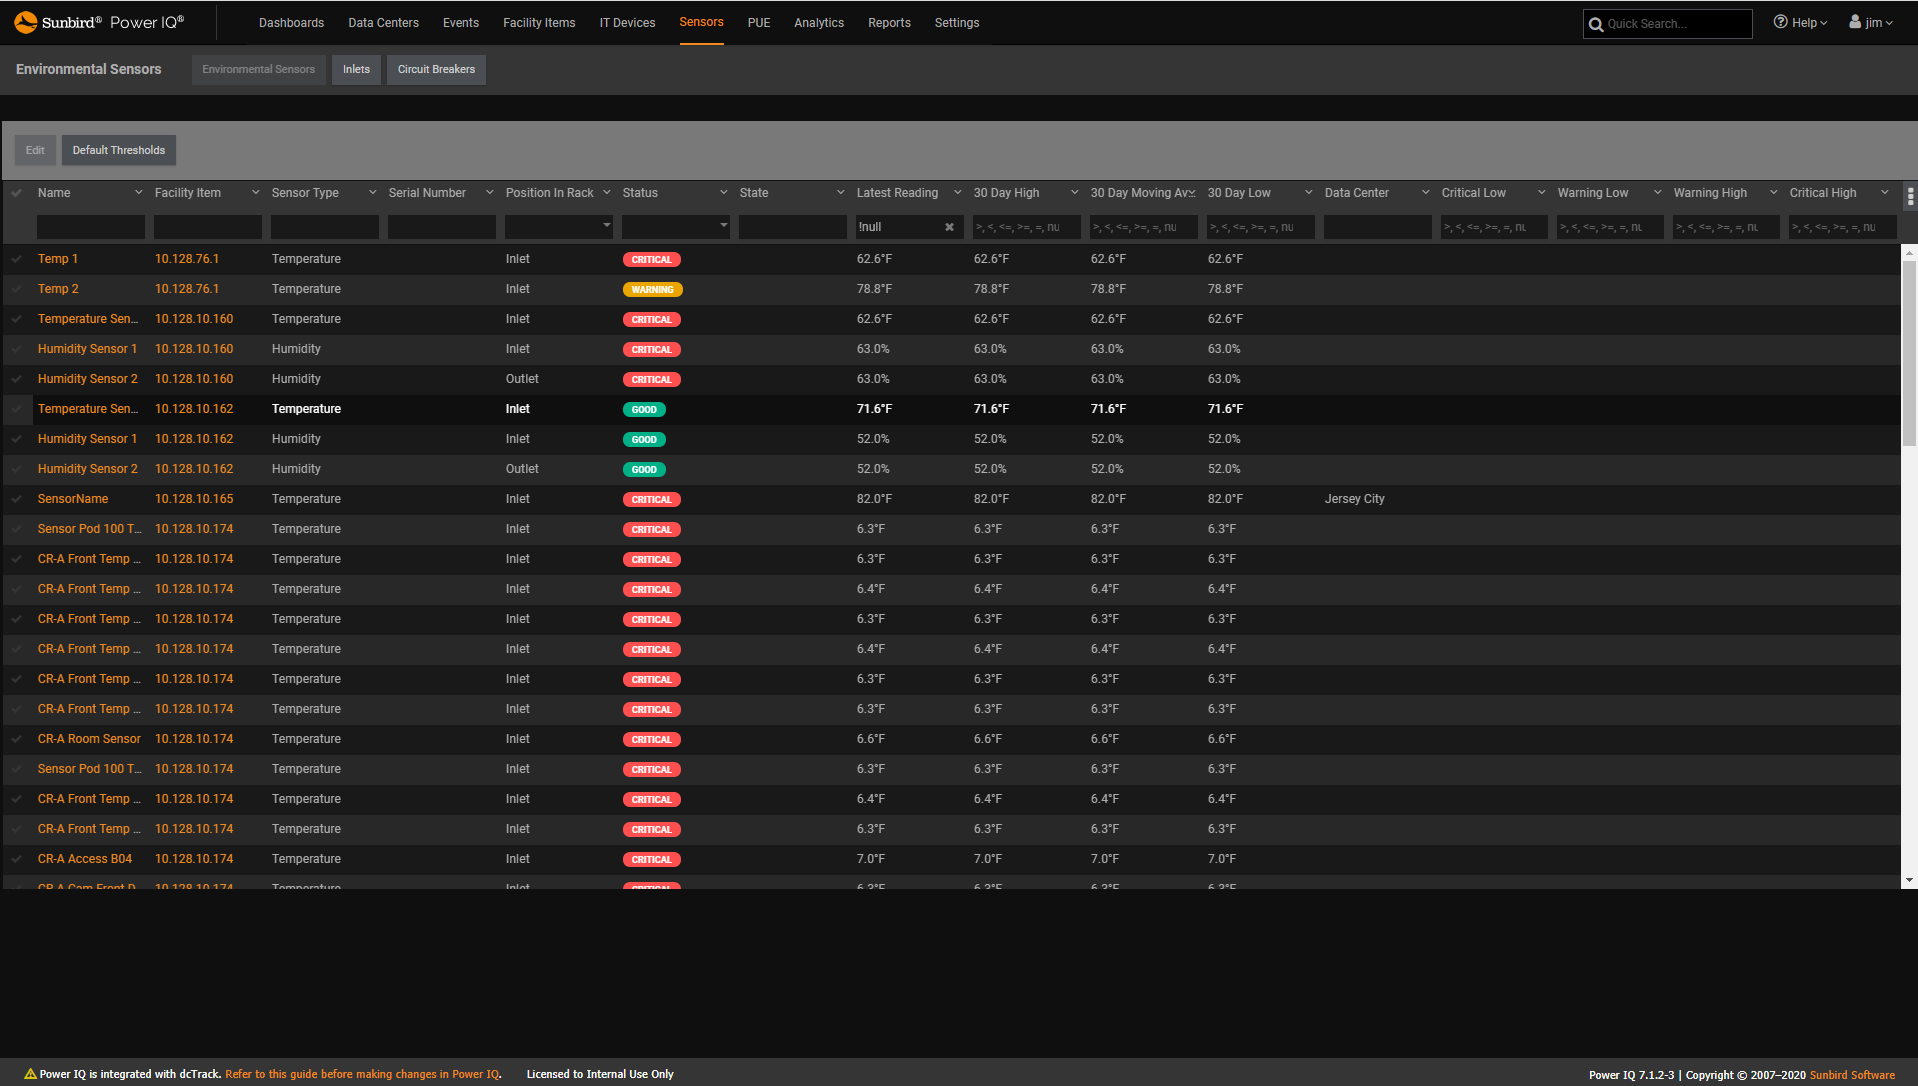
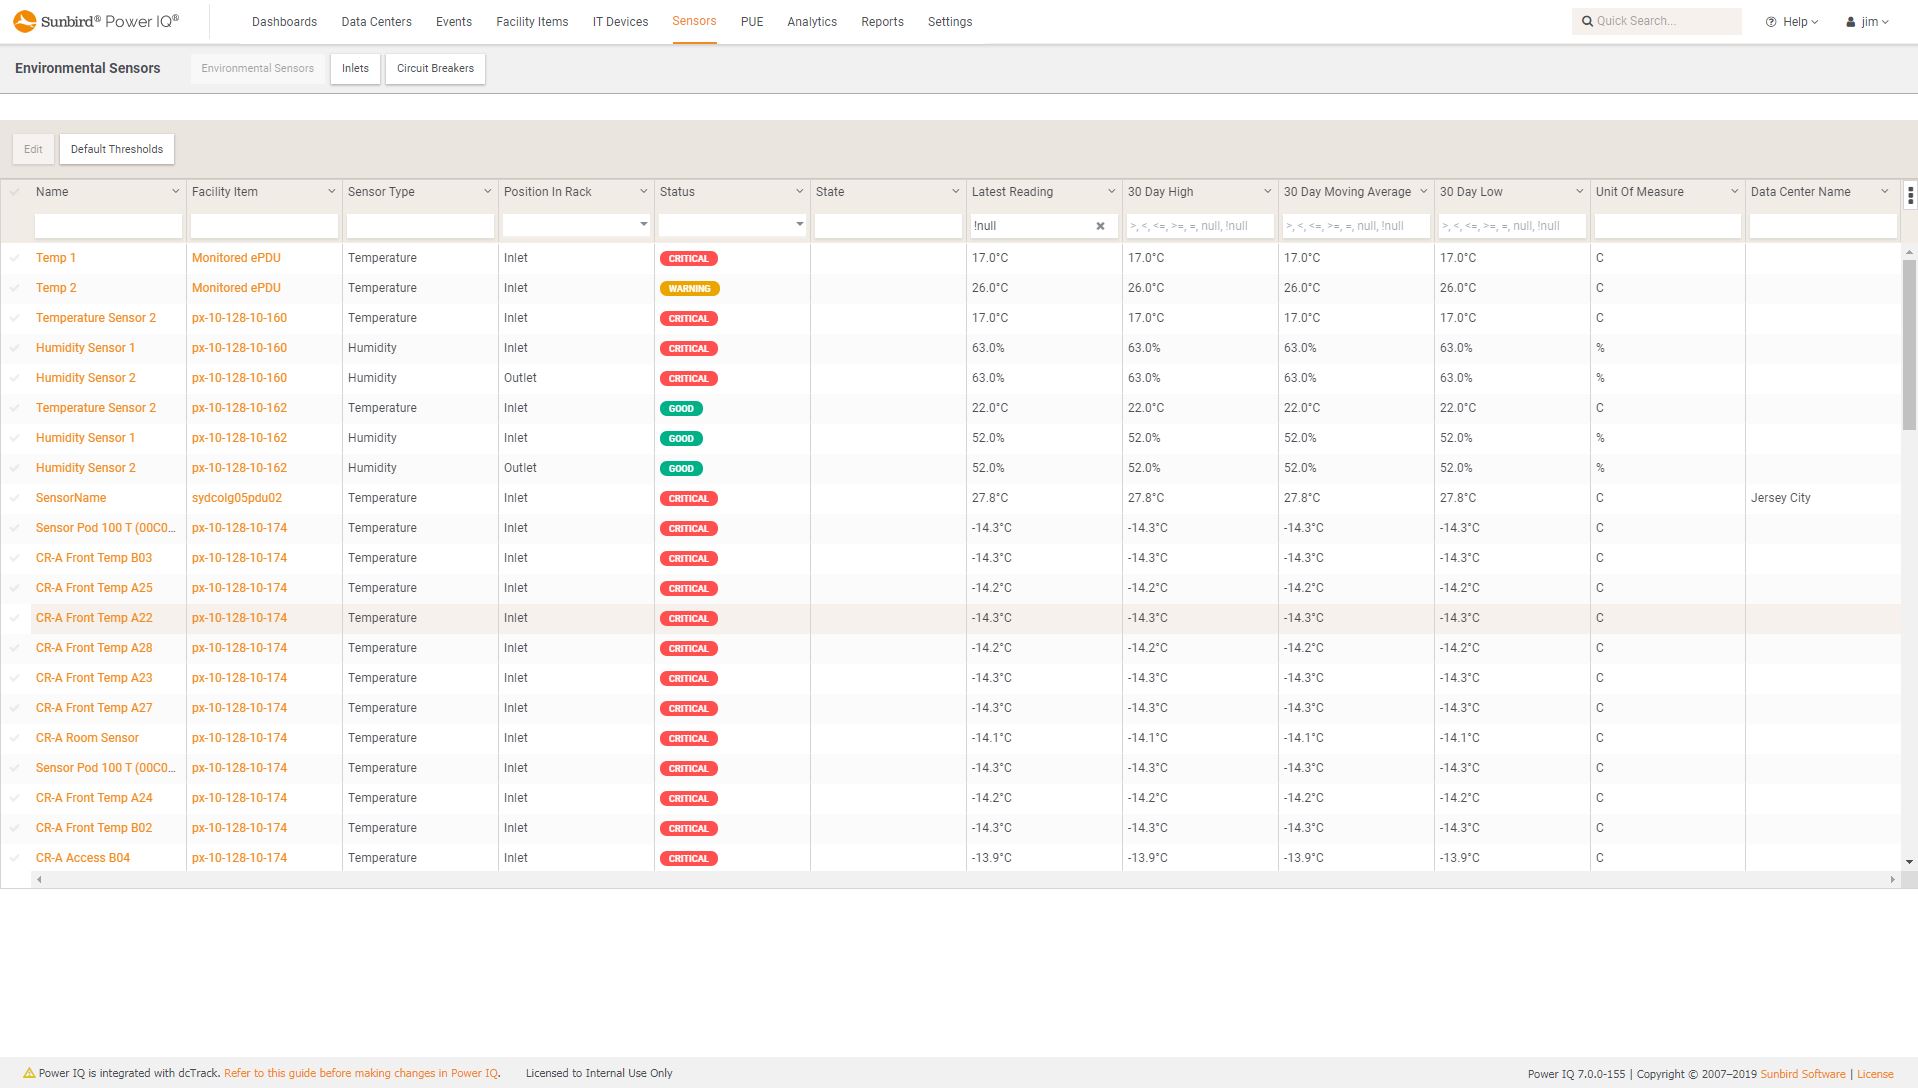
 Power IQ DCIM Monitoring | Environment ManagementEnvironmental Sensor Threshold Monitoring and Reporting
 -
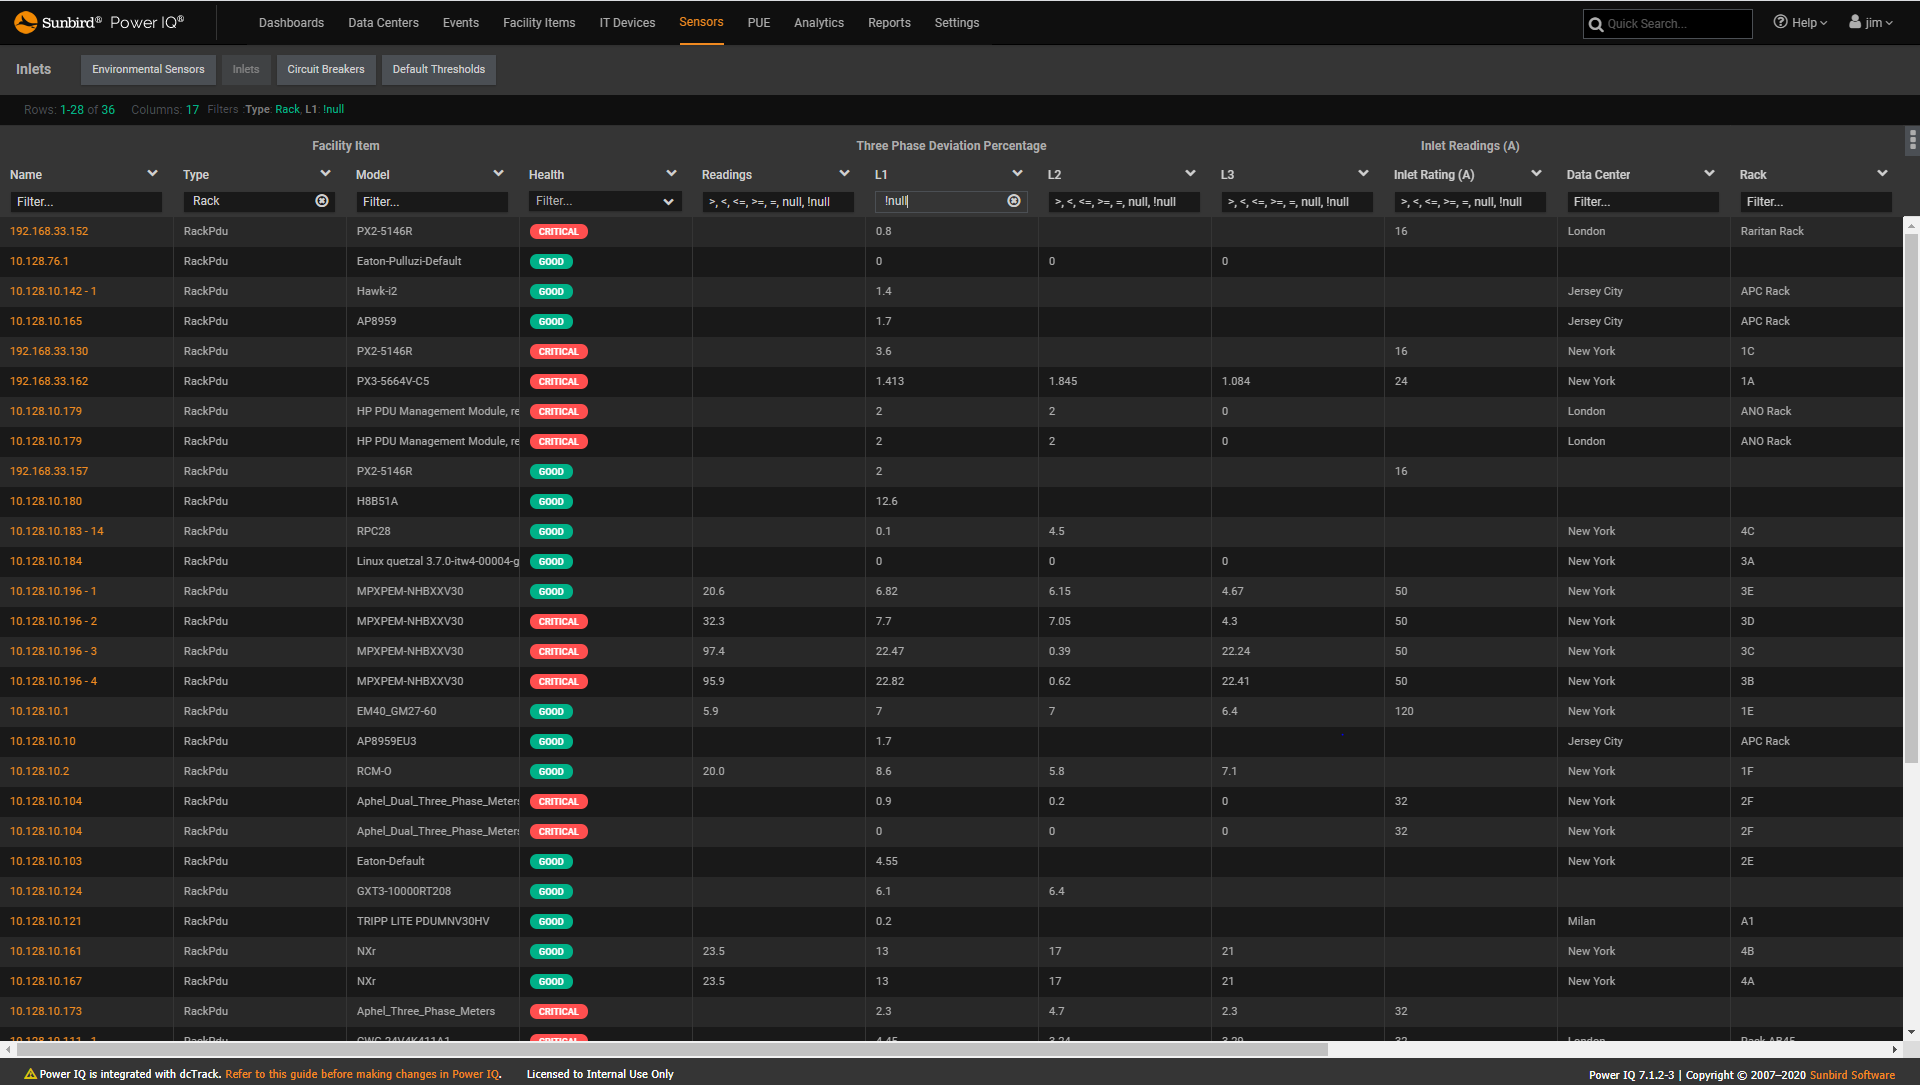
 Power IQ DCIM Monitoring | Power ManagementPower Sensor Threshold Monitoring and Reporting
 -
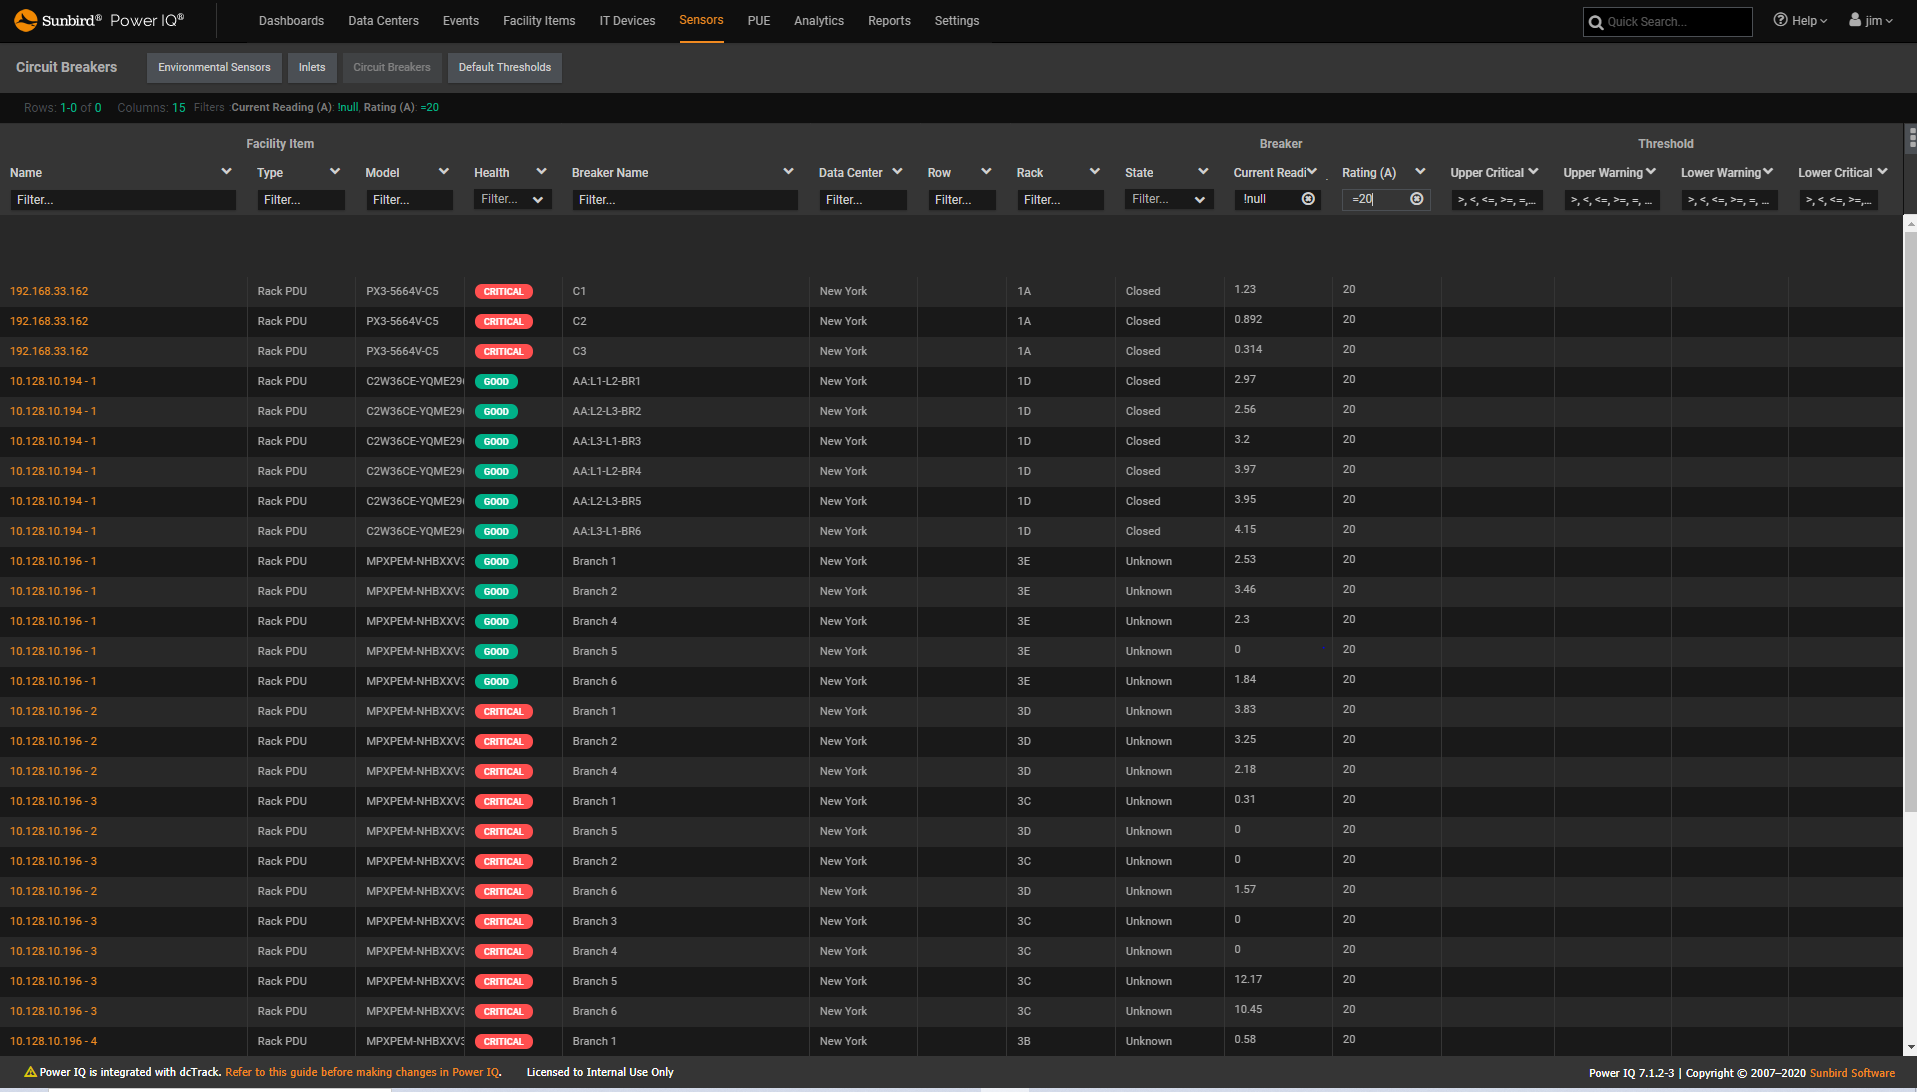
 Power IQ DCIM Monitoring | Power ManagementRack PDU Circuit Breaker Threshold Monitoring and Reporting
 -
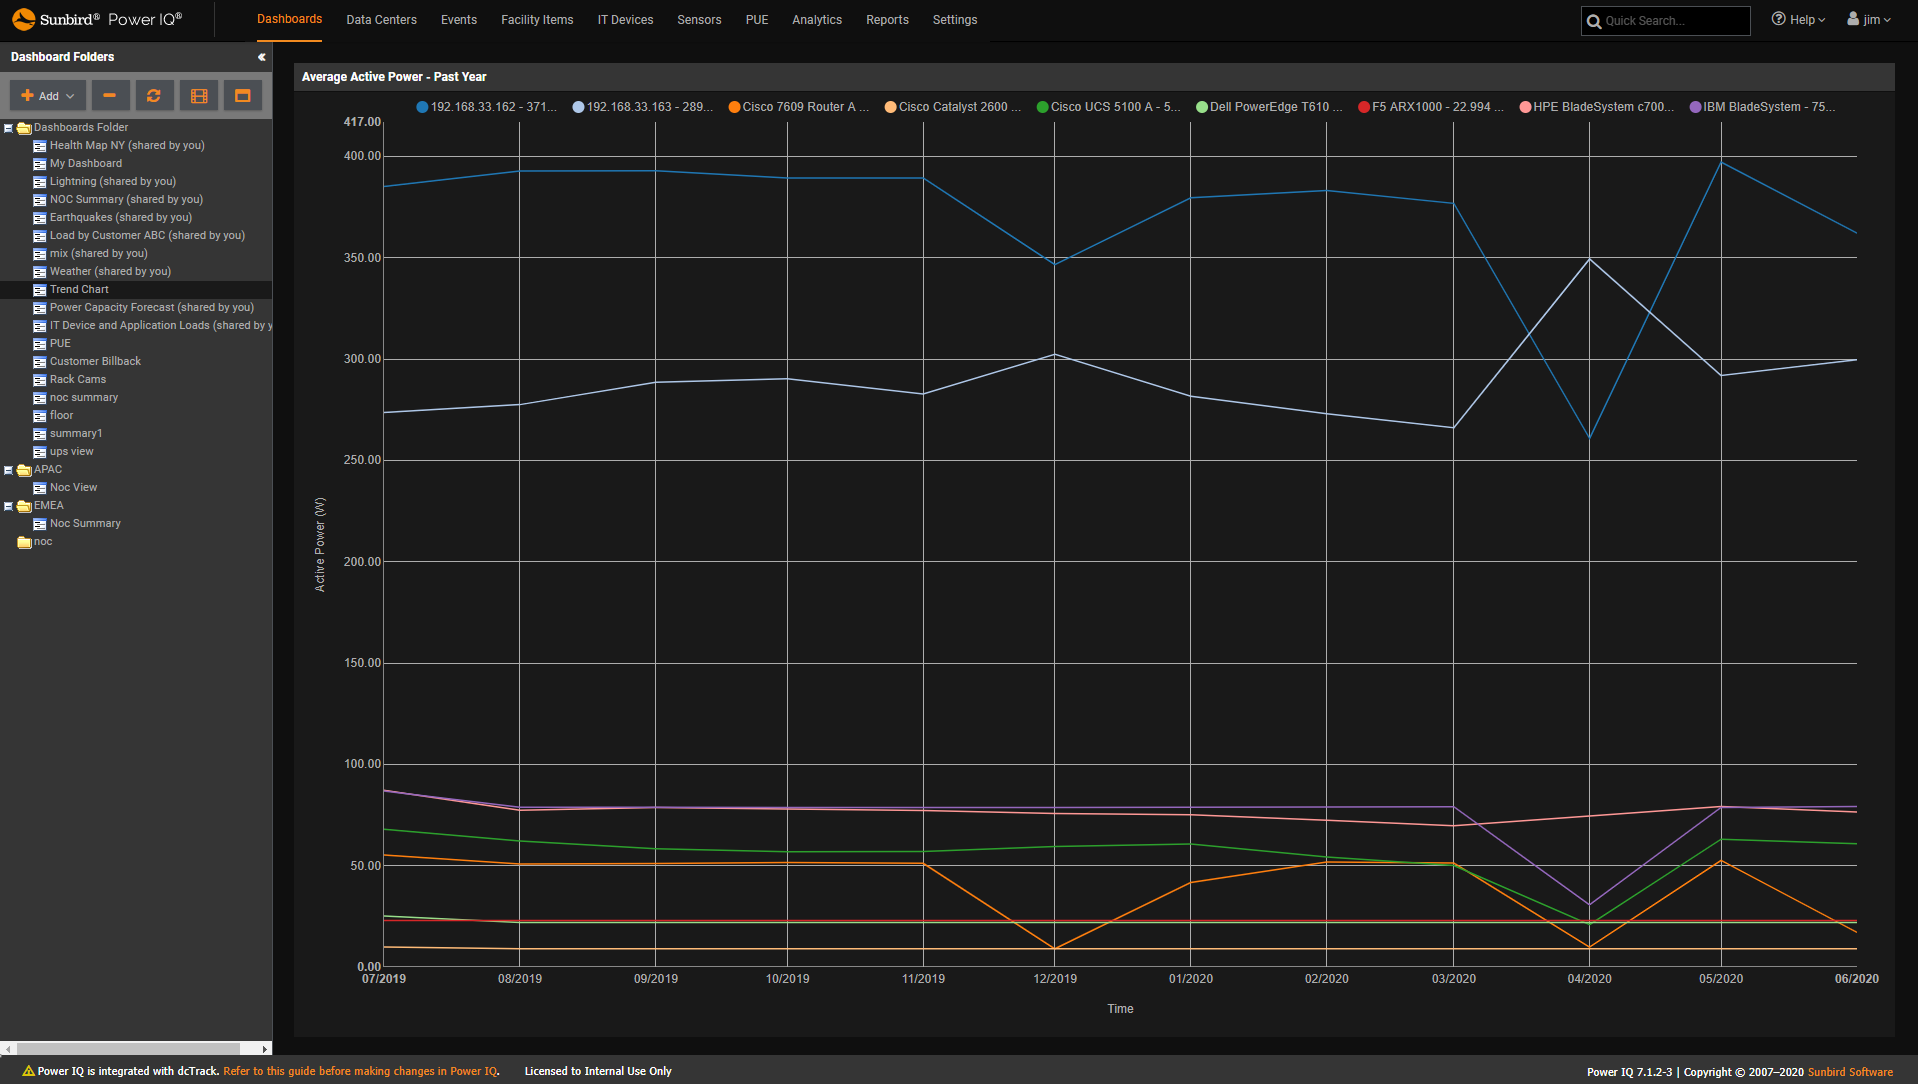
 Power IQ DCIM Monitoring | Power Management | BI & Data AnalyticsTrend Measured Readings
 -
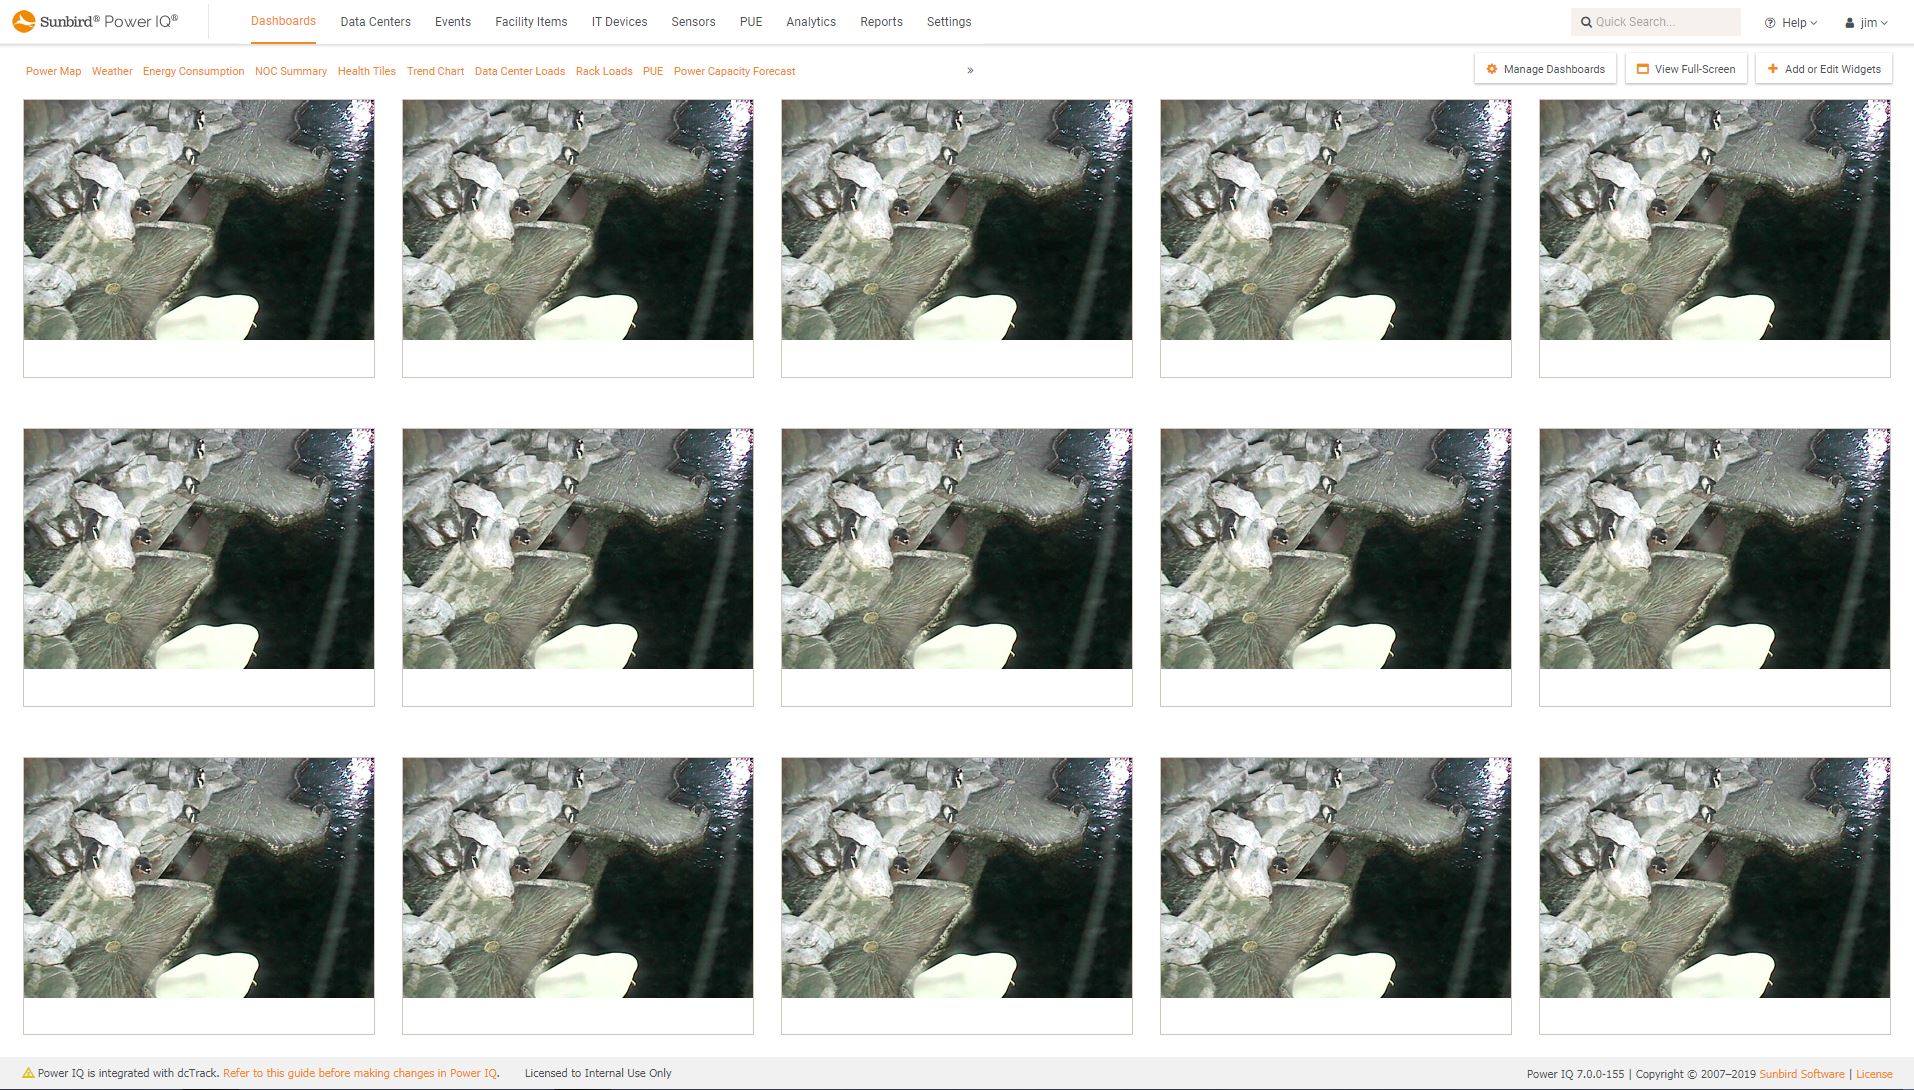
 Power IQ DCIM Monitoring | DashboardsSecurity Camera Video
 -
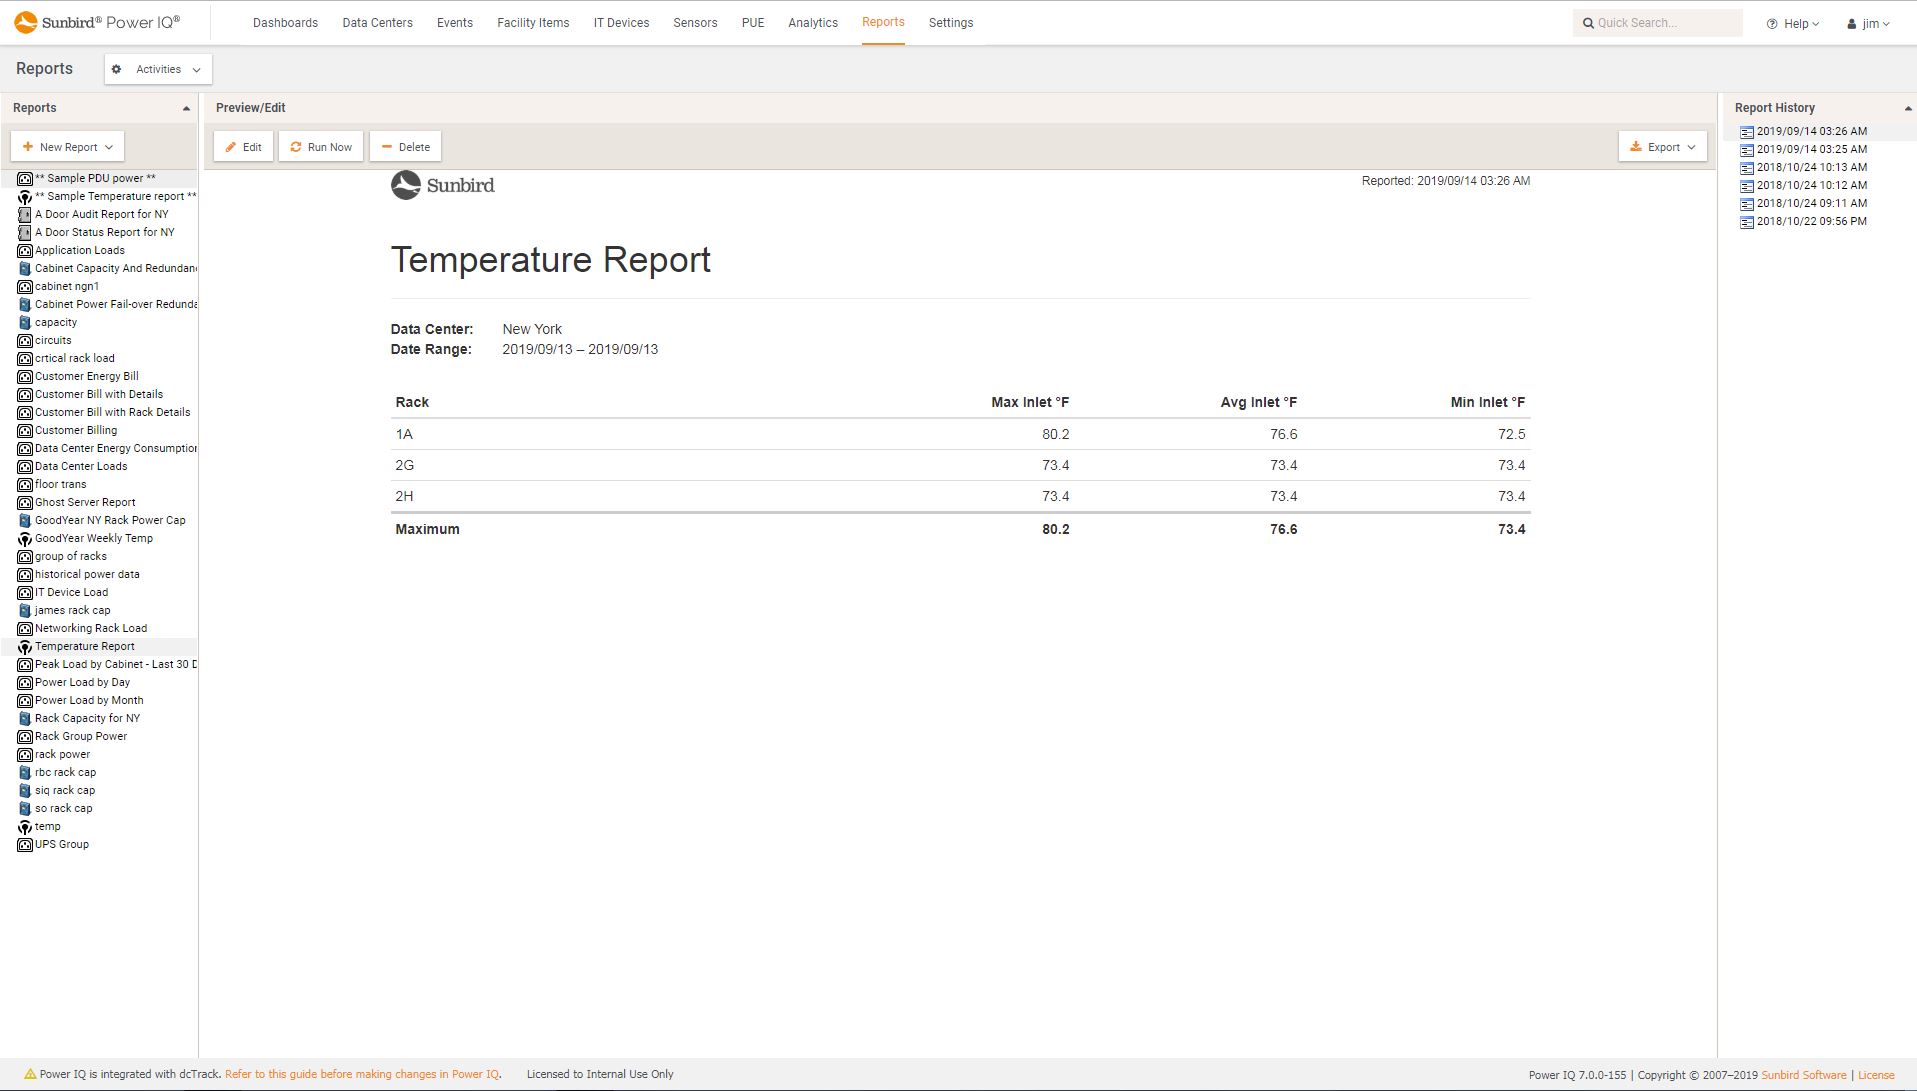
 Power IQ DCIM Monitoring | Environment ManagementRack Temperature Report
 -
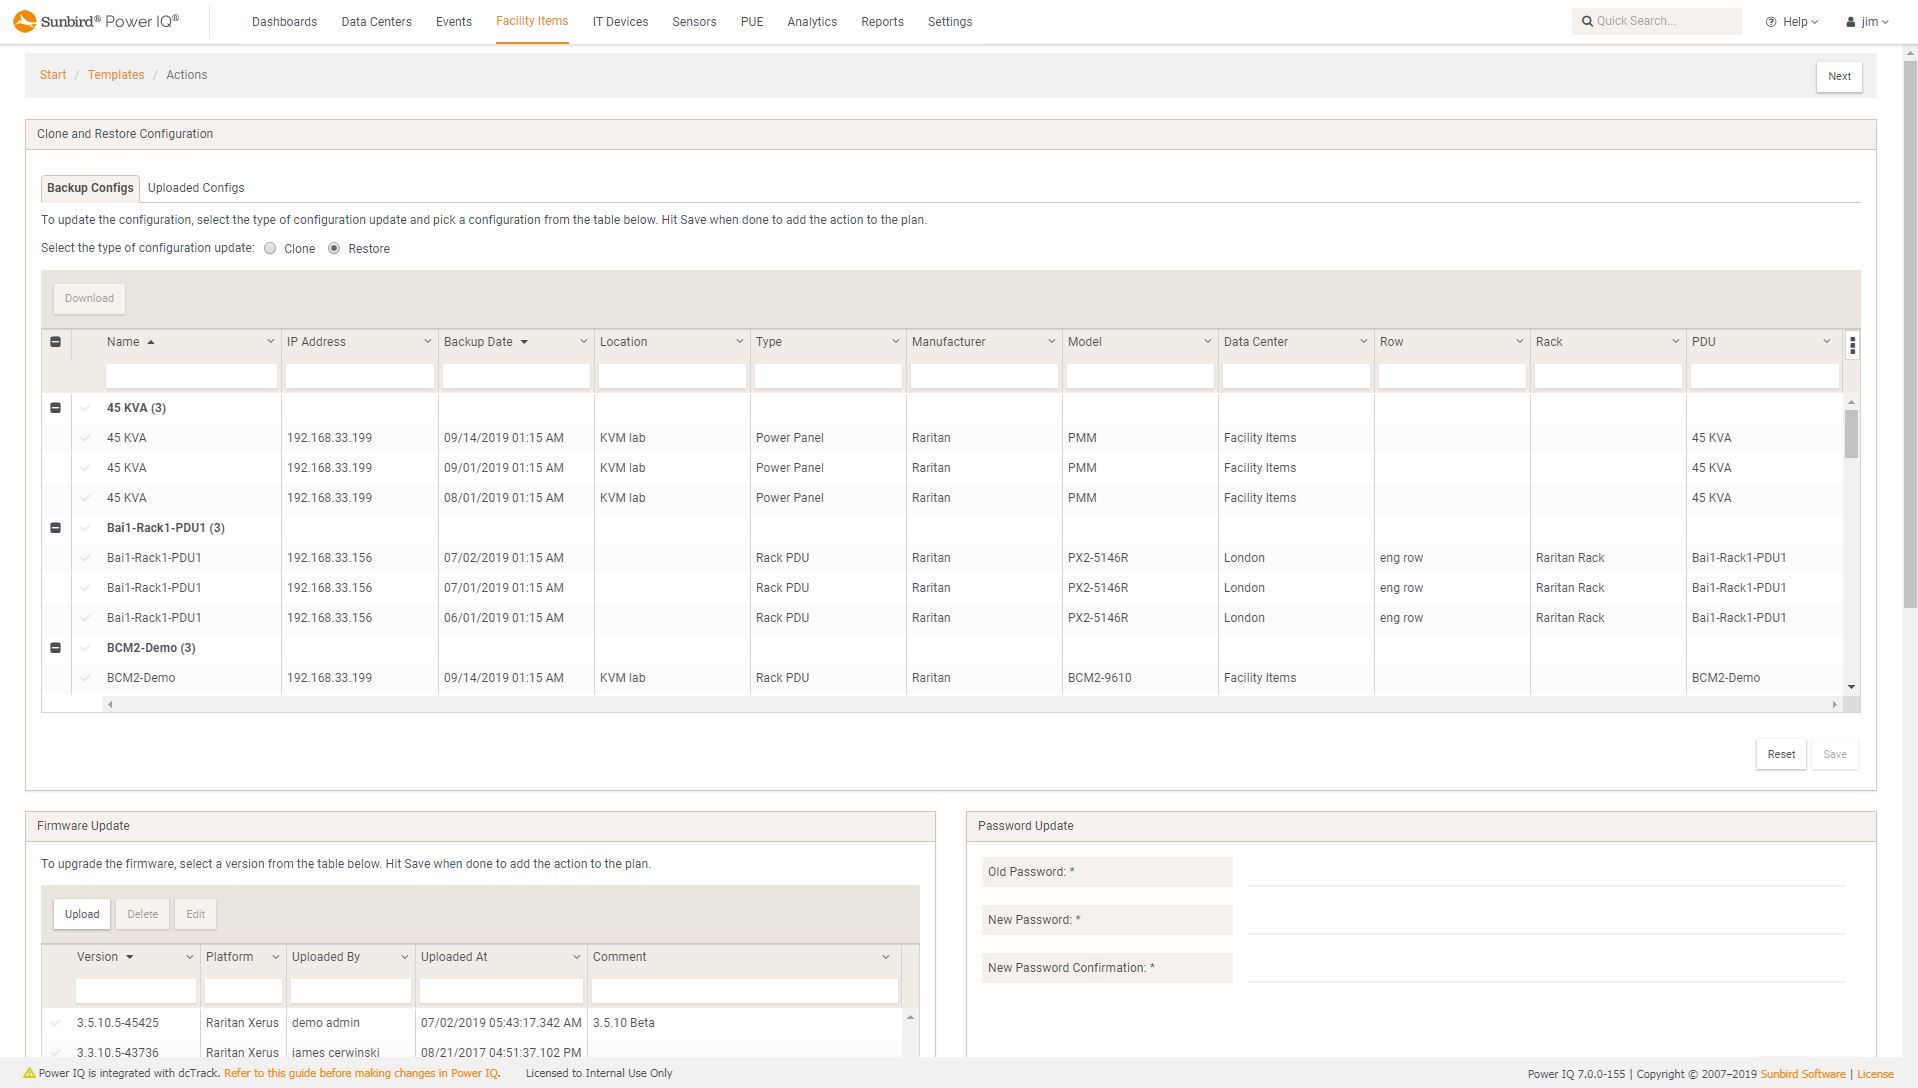
 Power IQ DCIM Monitoring | Power ManagementRack PDU Bulk Configuration
 -
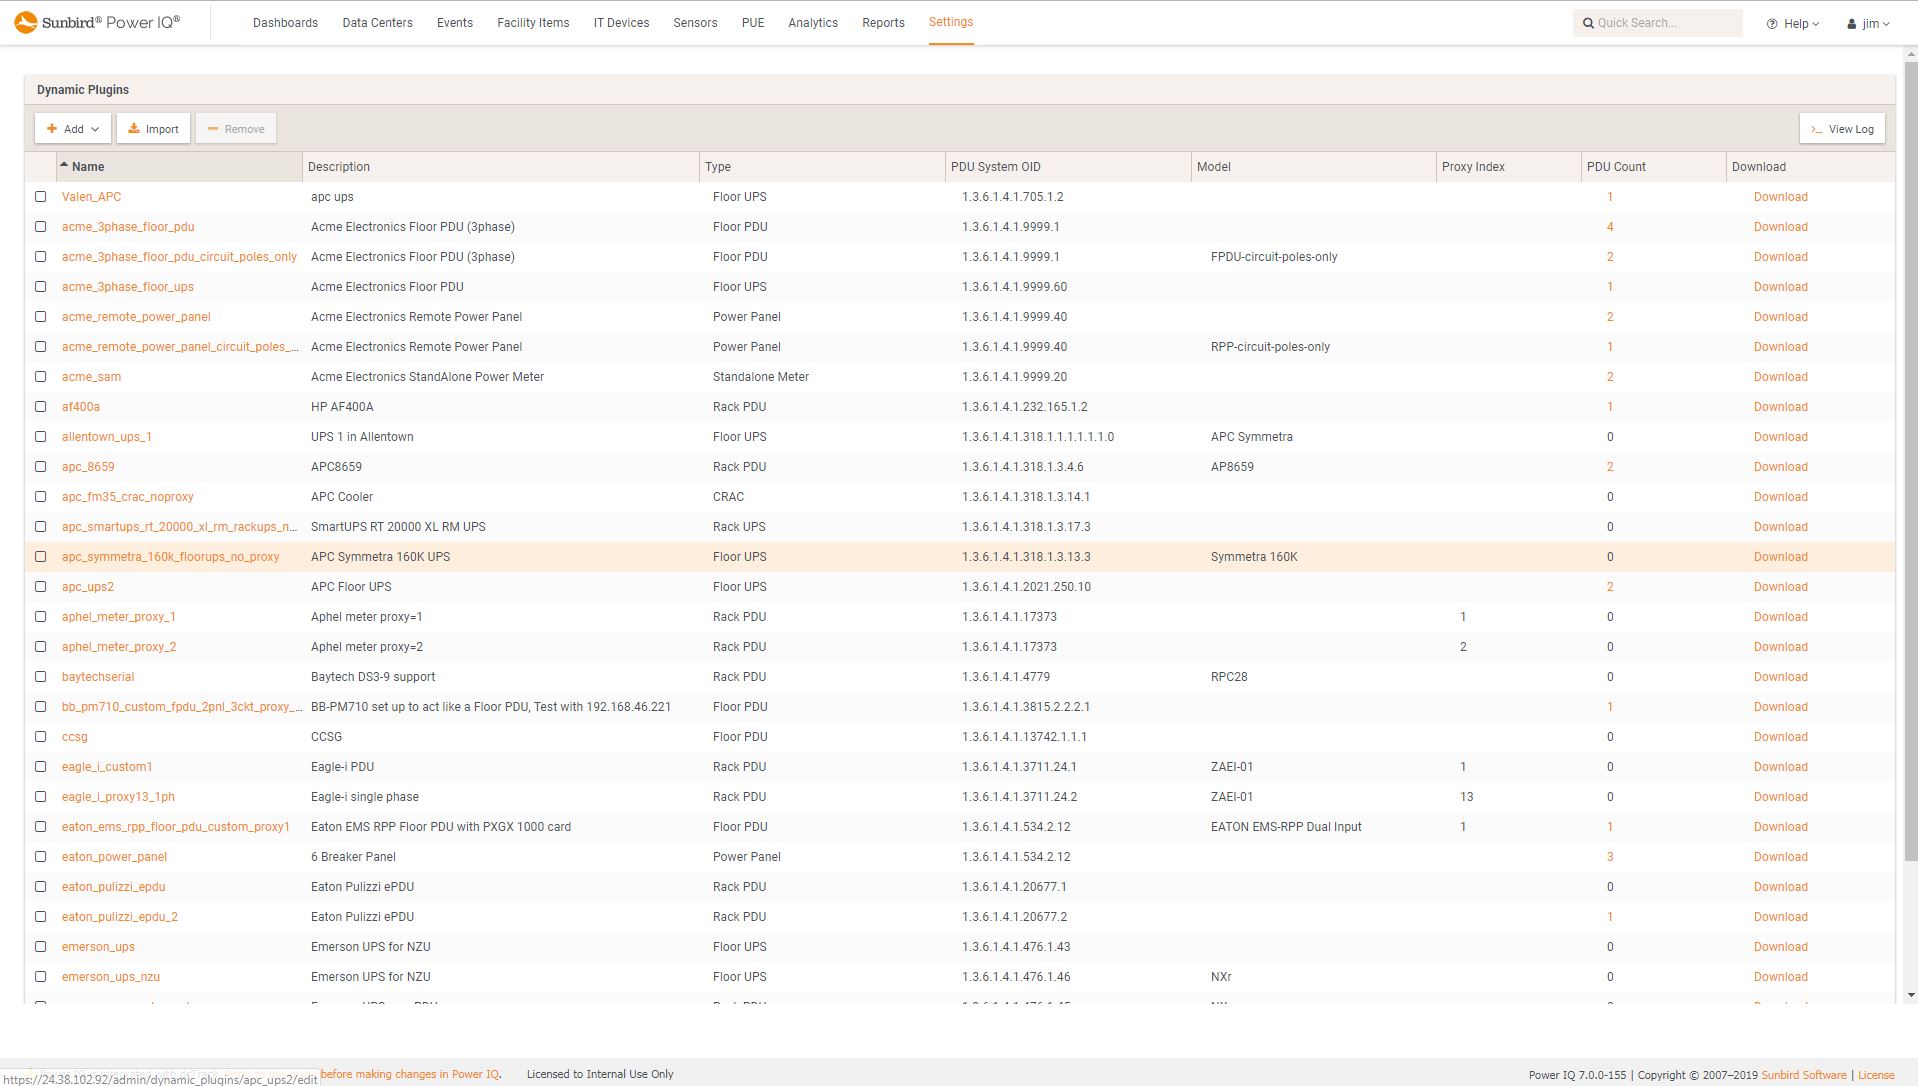
 Power IQ DCIM Monitoring | Power ManagementMulti Vendor Data Collection
 -
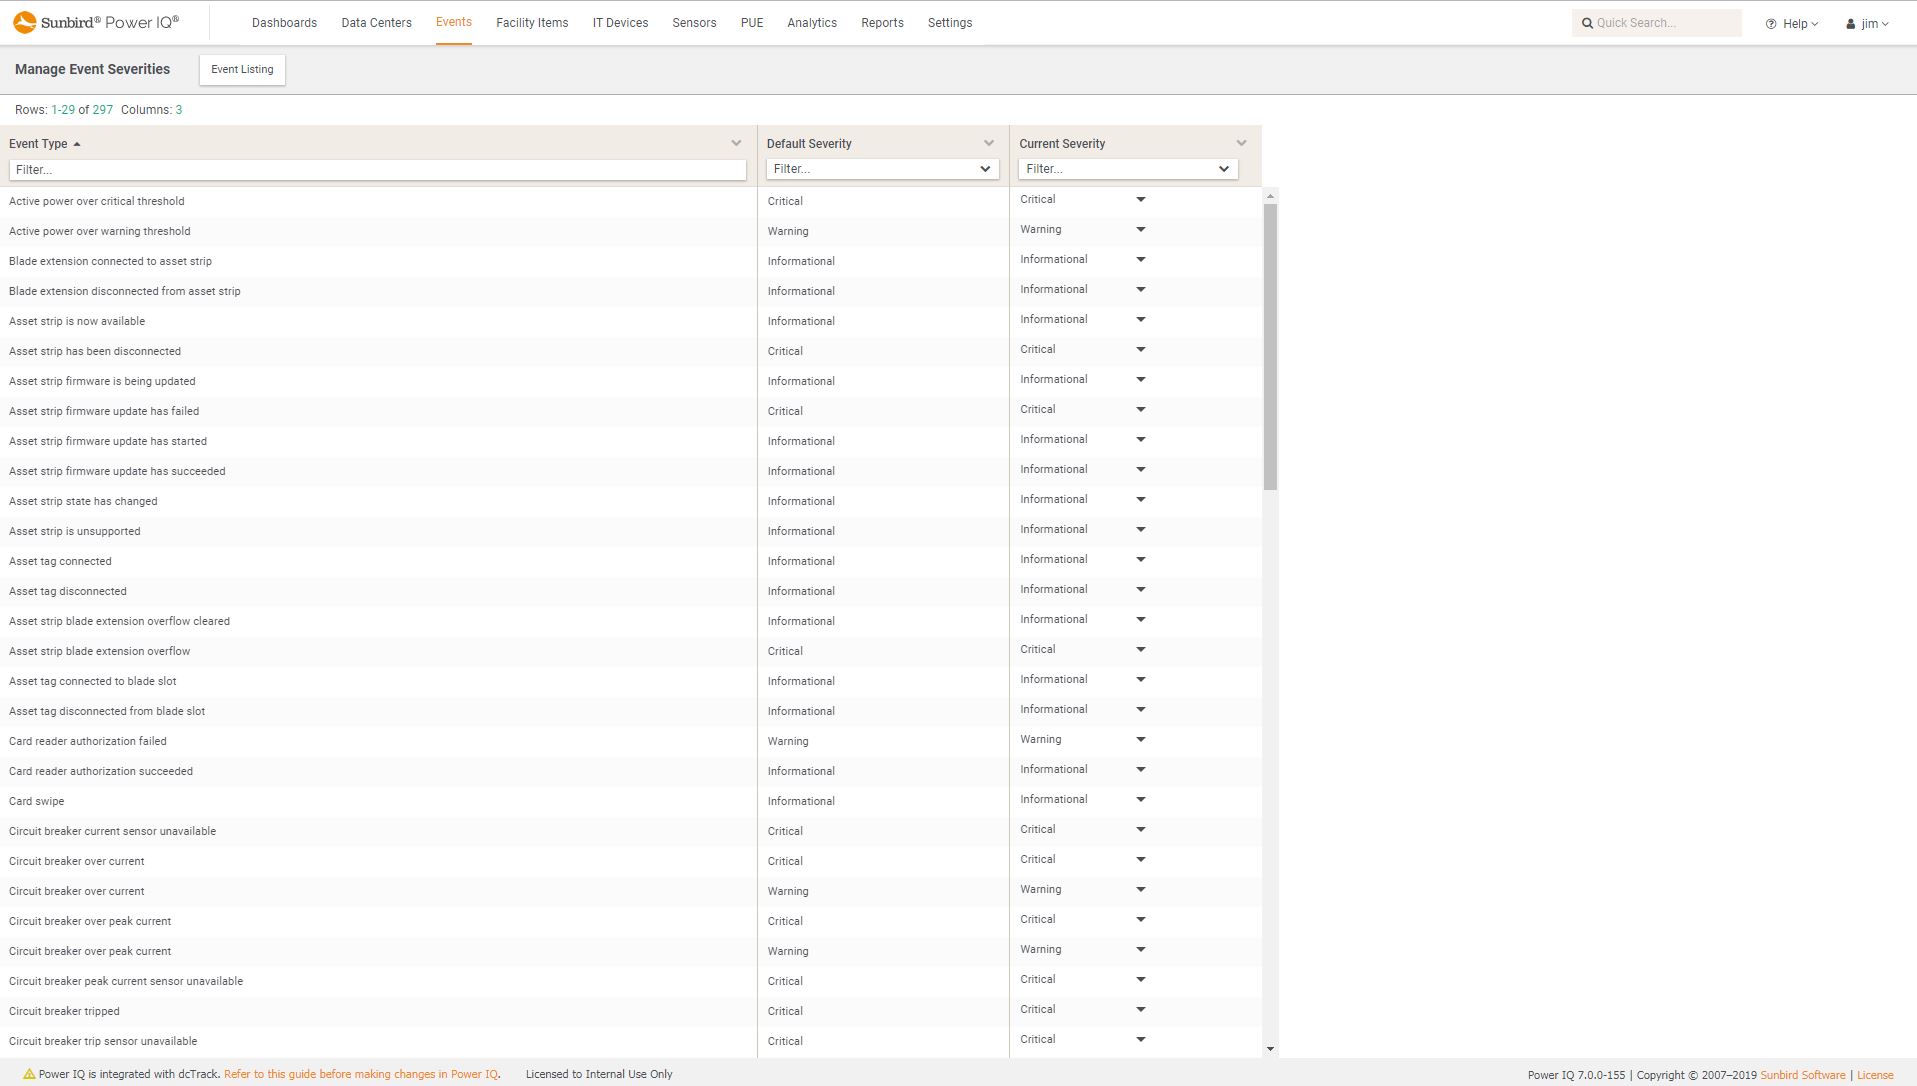
 Power IQ DCIM Monitoring | Power ManagementManage Severity Levels
 -
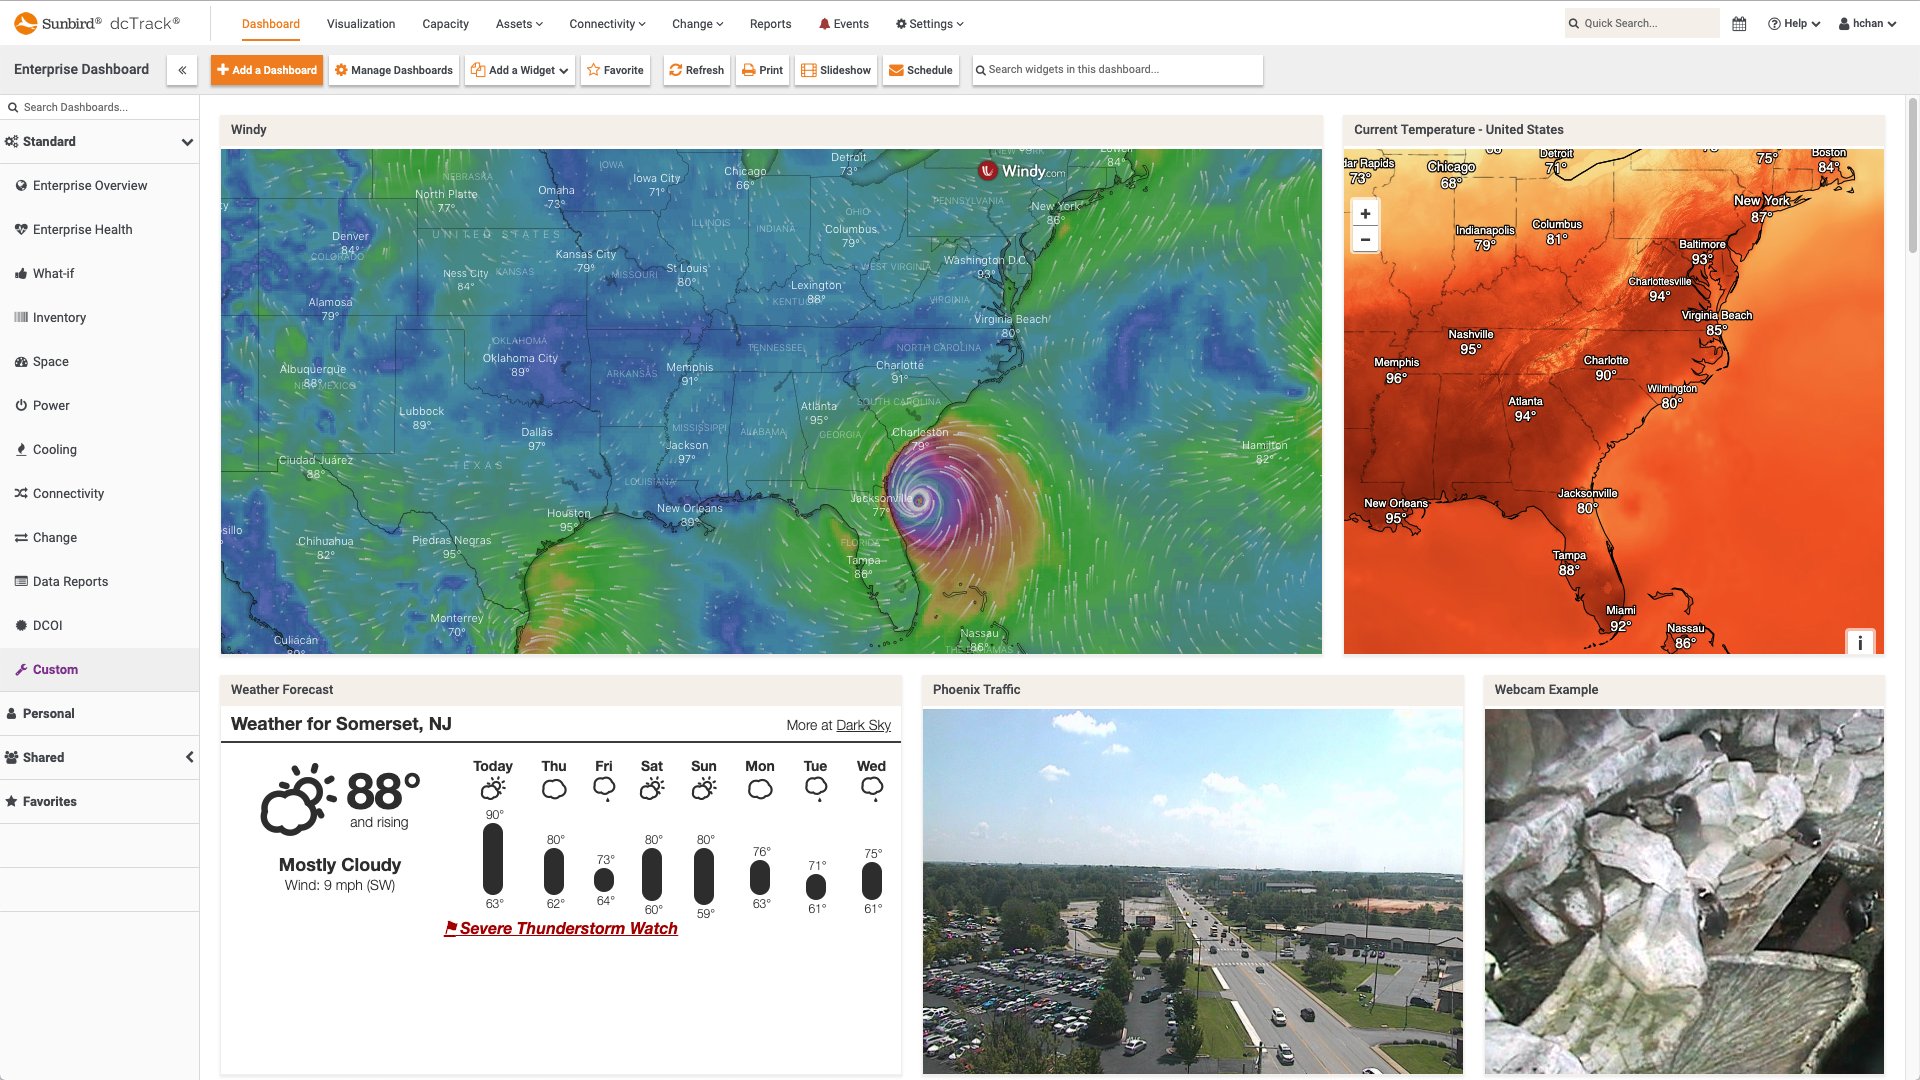
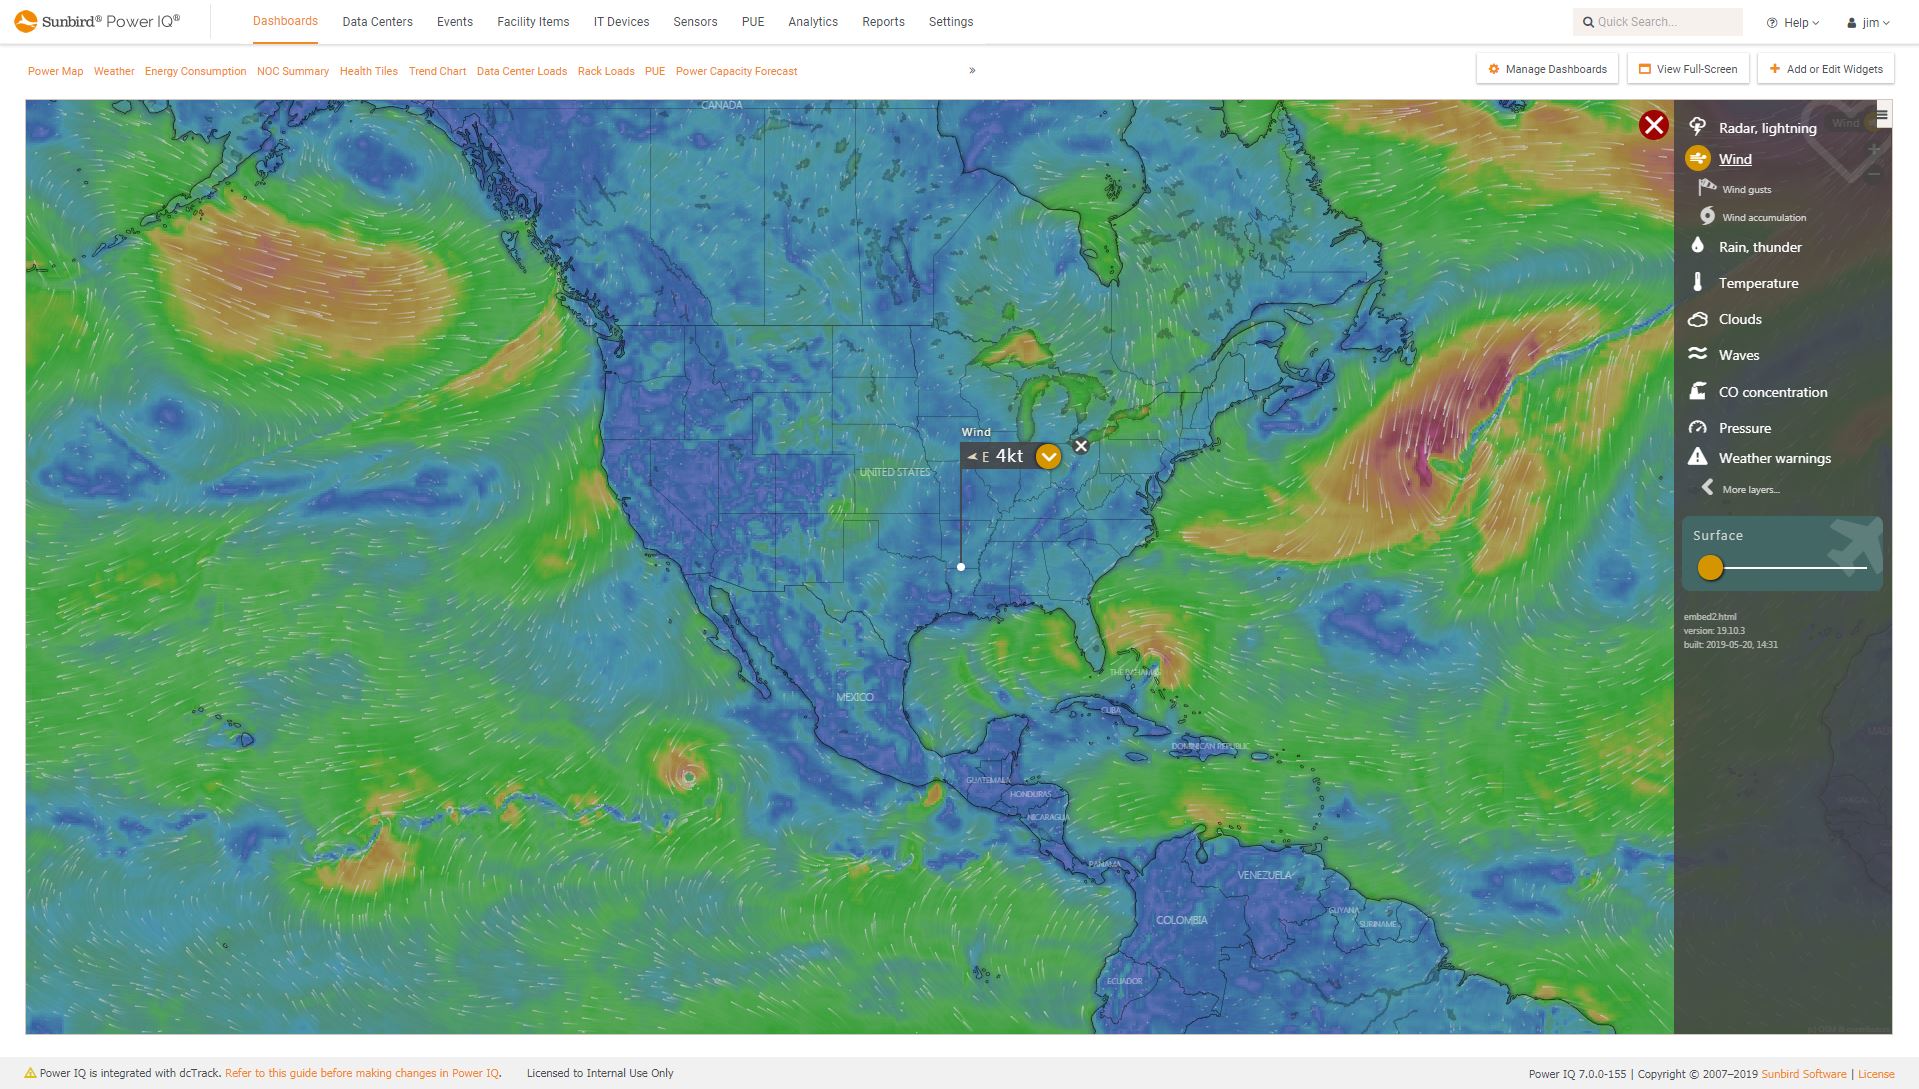
 Power IQ DCIM Monitoring | DashboardsLive Weather Maps
 -
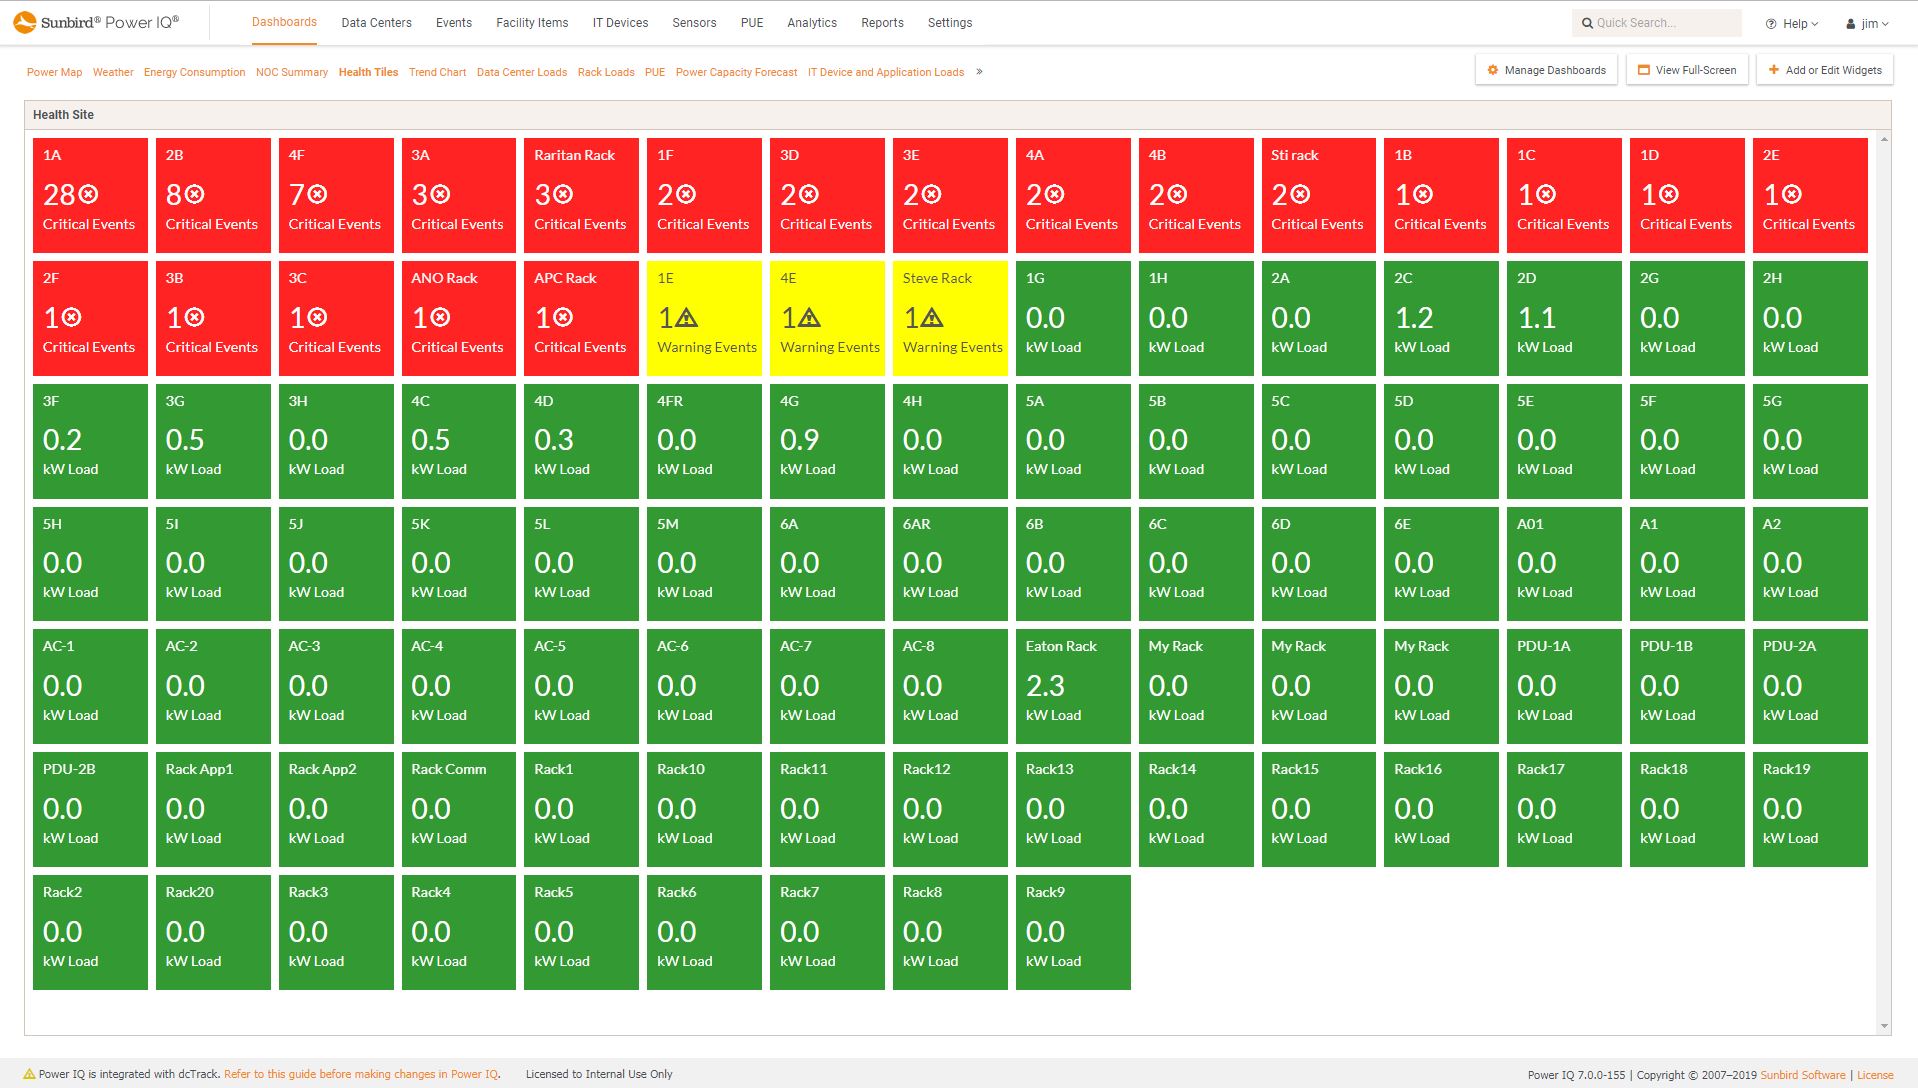
 Power IQ DCIM Monitoring | Power Management | Capacity ManagementHealth and Capacity Tiles
 -
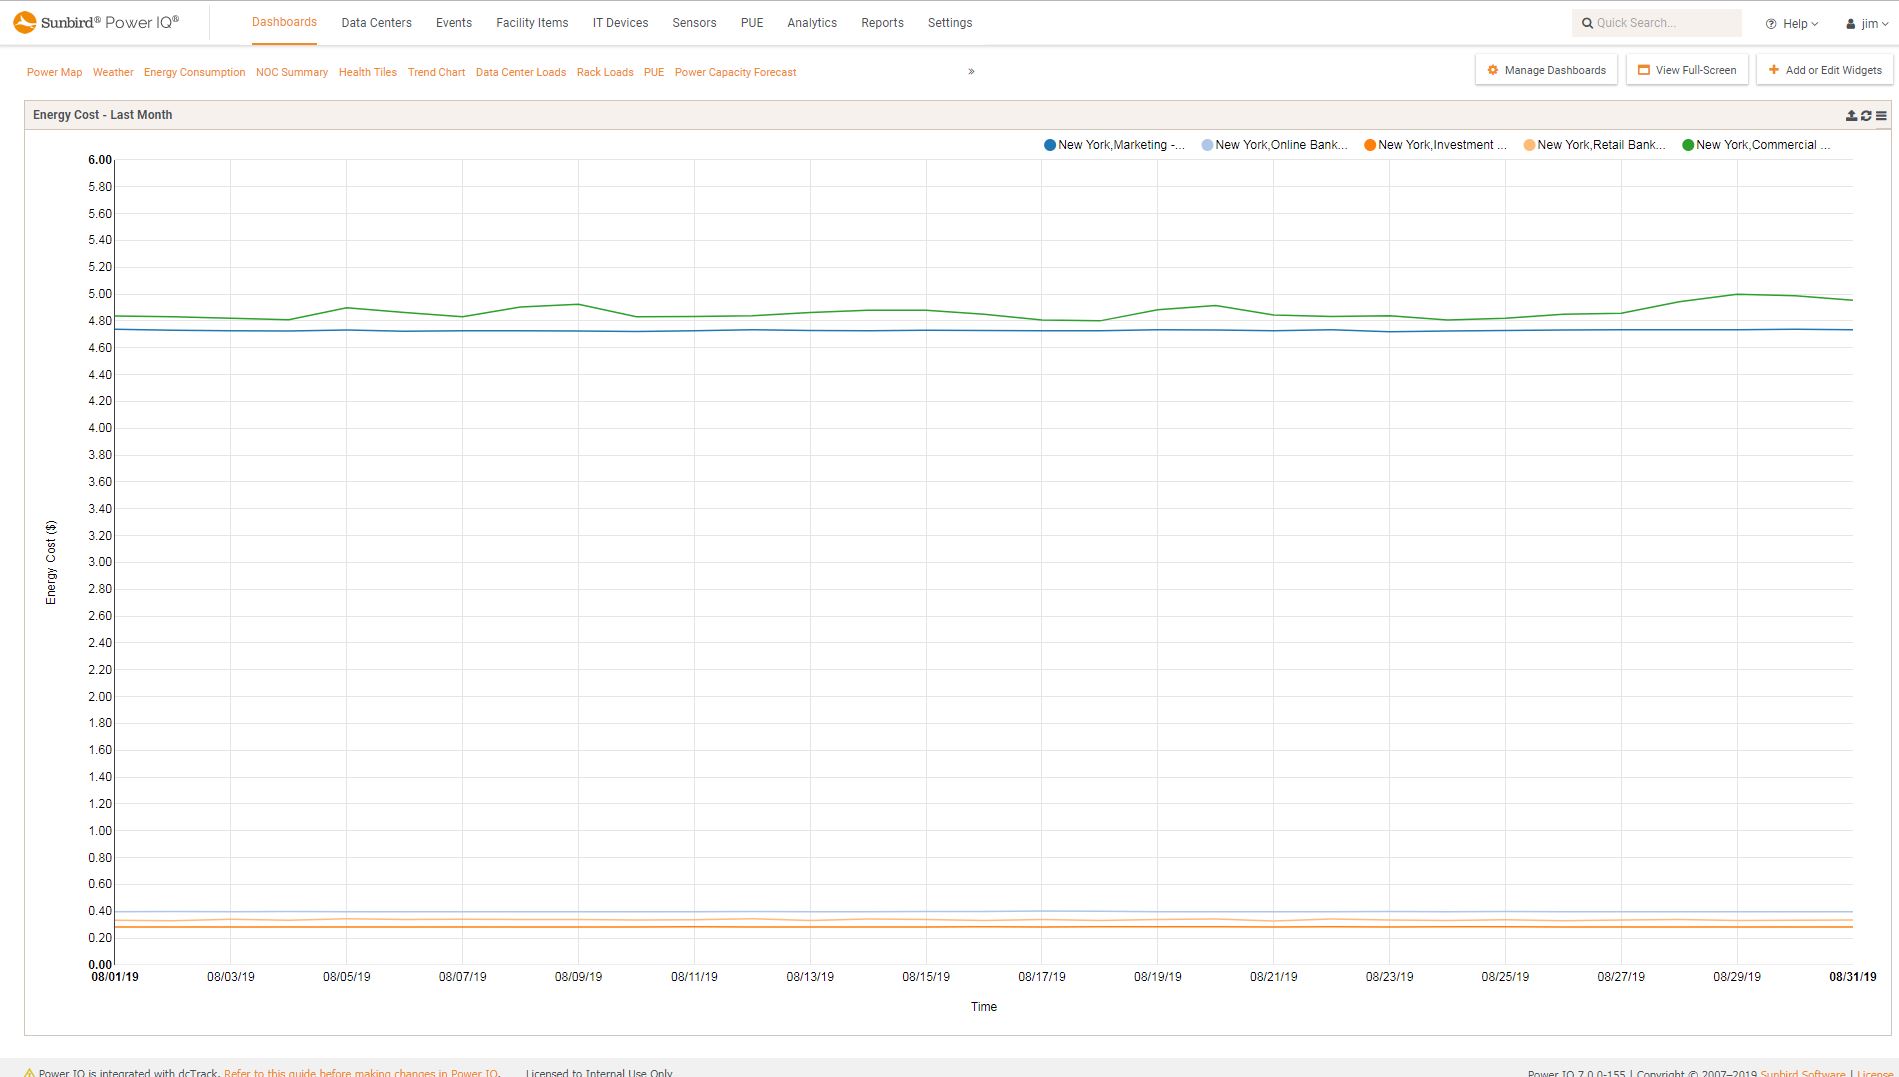
 Power IQ DCIM Monitoring | Energy ManagementCustomer Energy Consumption
 -
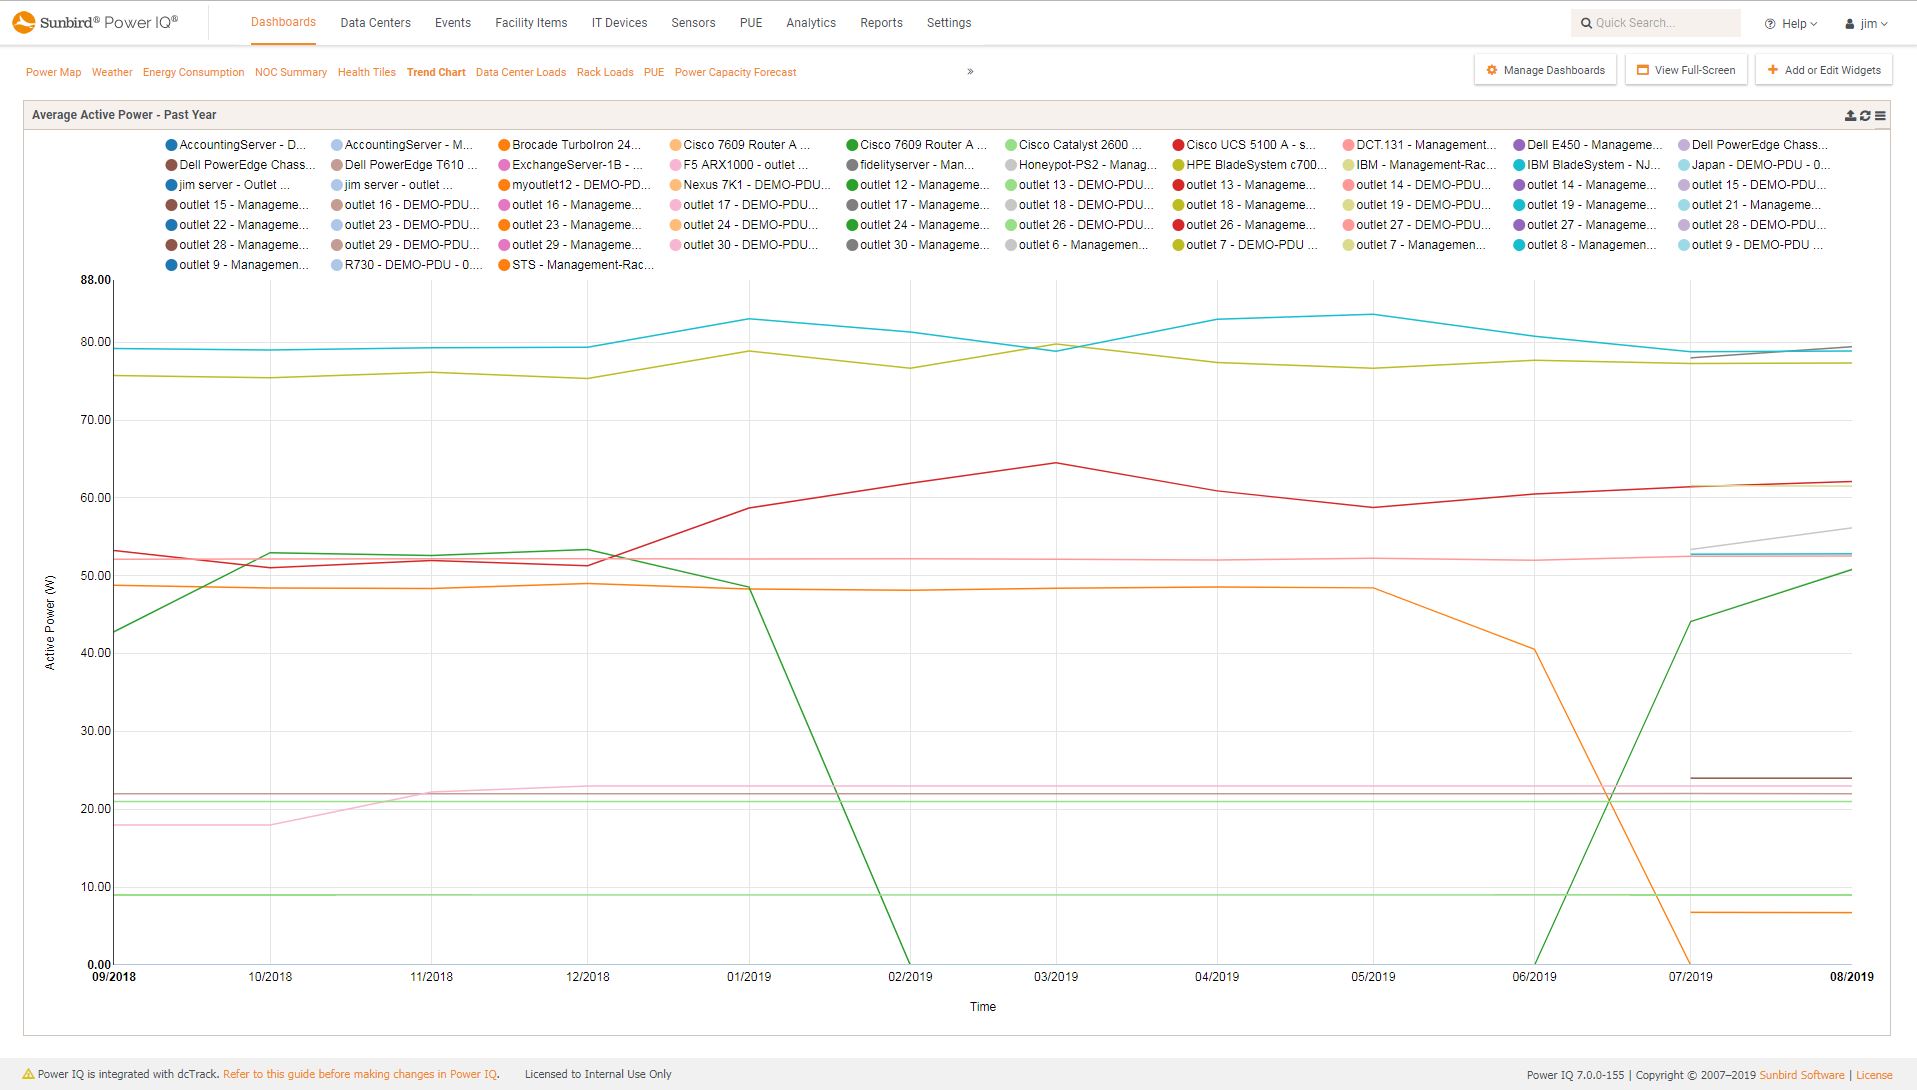
 Power IQ DCIM Monitoring | Power ManagementCompute Device Trend Chart
 -
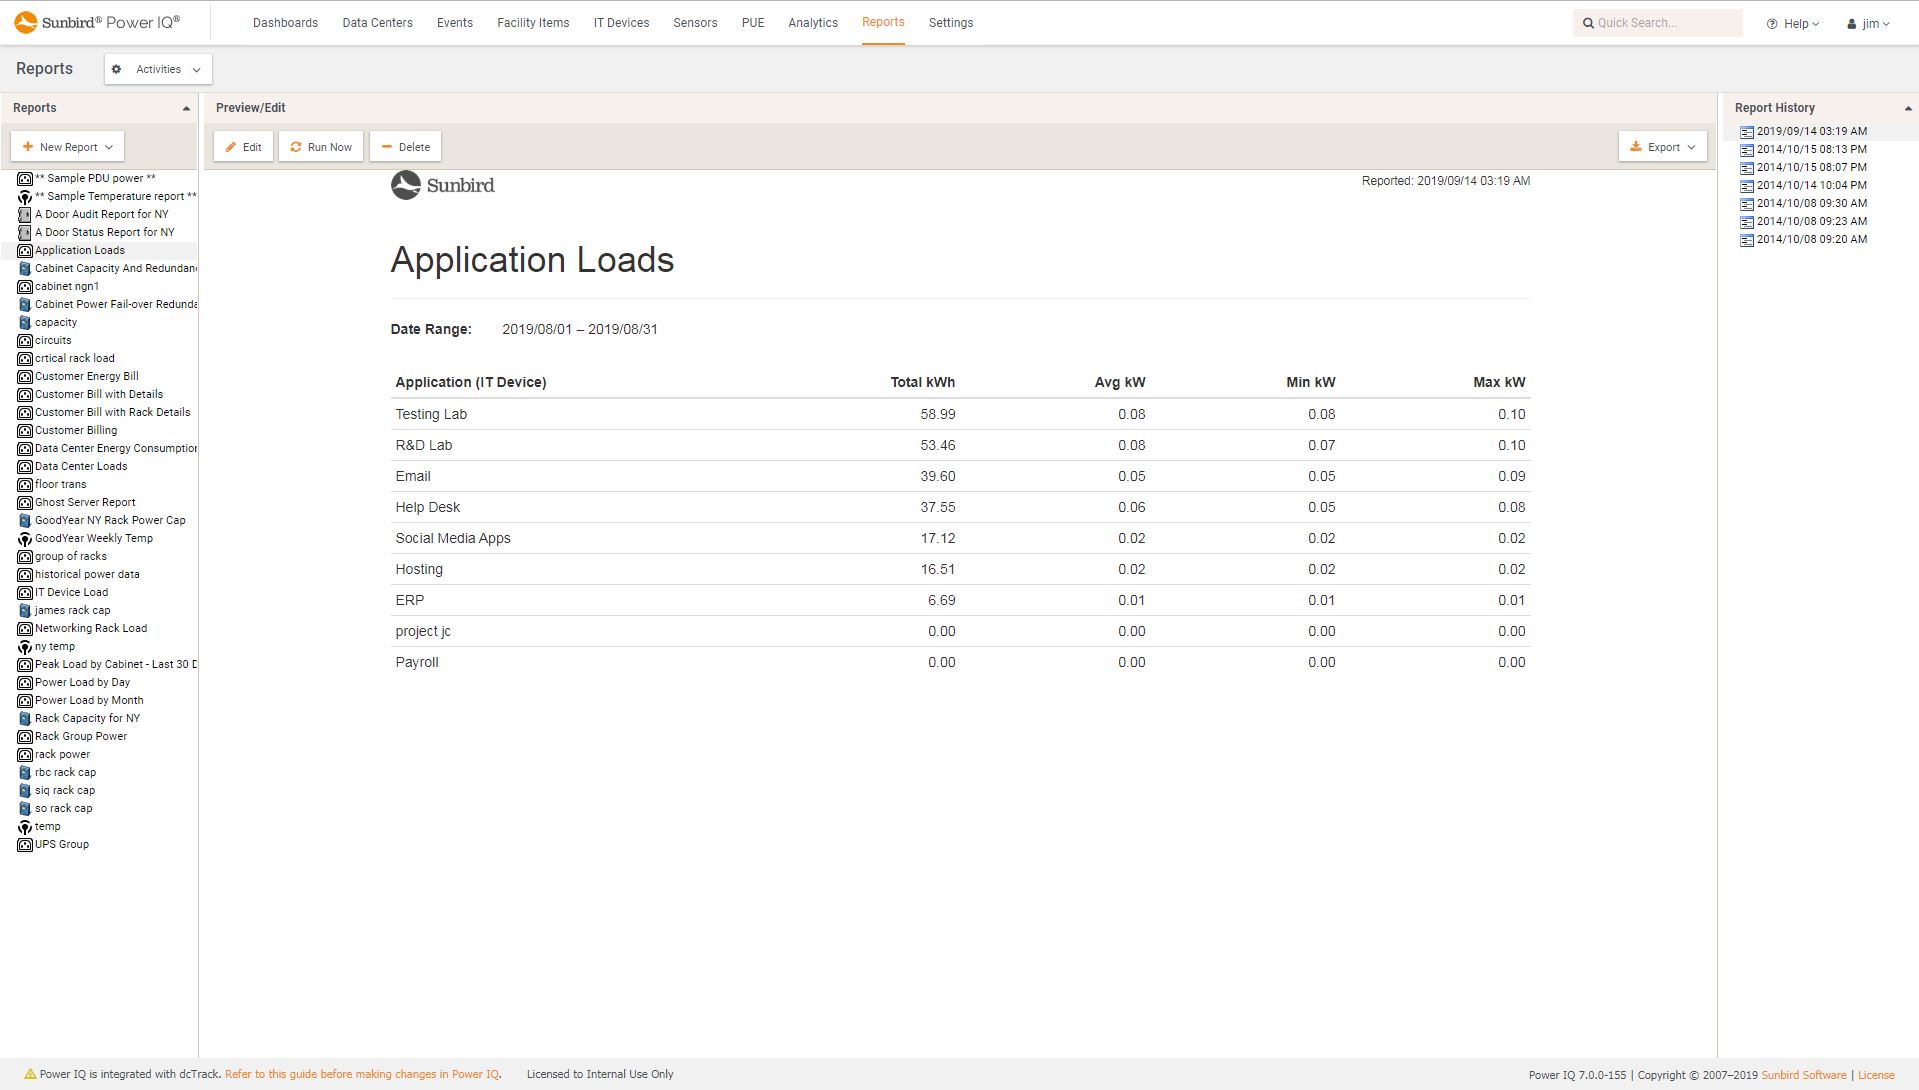
 Power IQ DCIM Monitoring | Power ManagementApplication Load Report
 -
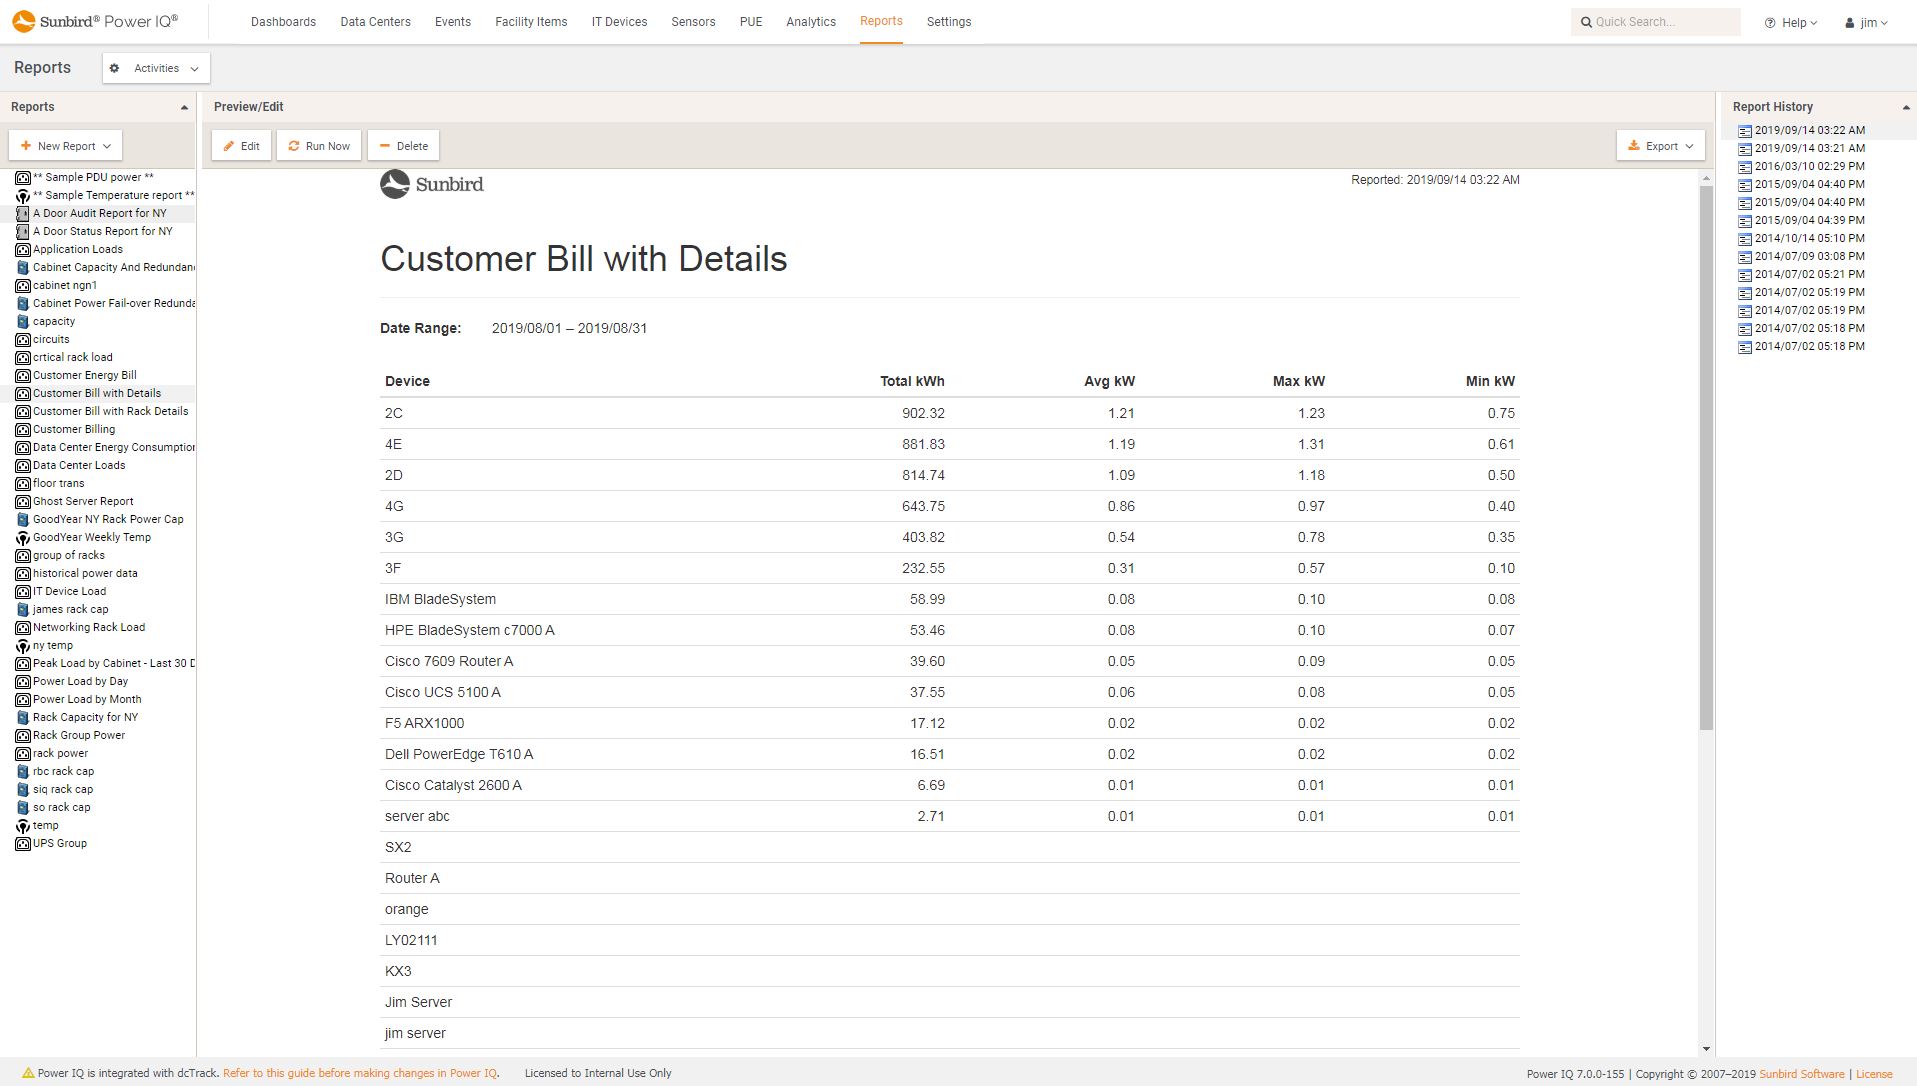
 Power IQ DCIM Monitoring | Power ManagementCustomer Billing Report
 -
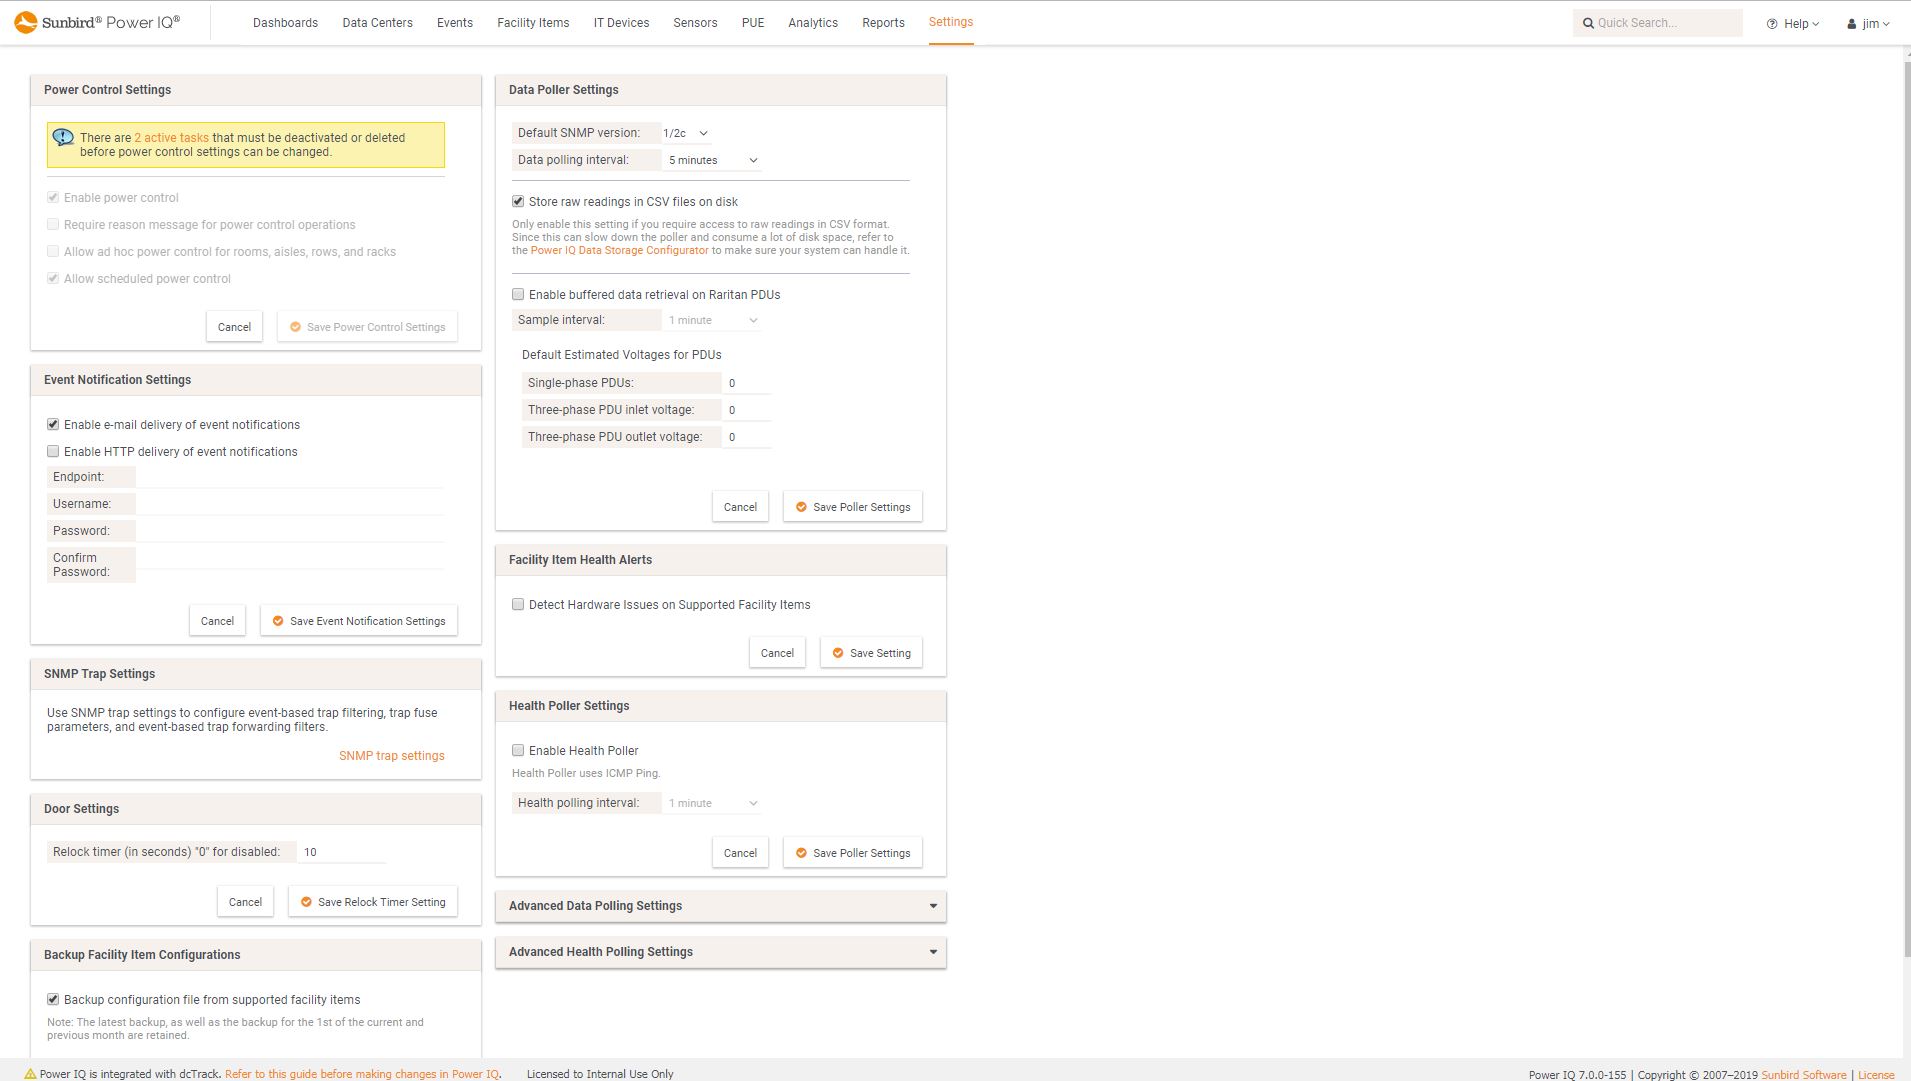
 Power IQ DCIM Monitoring | Power ManagementConfigurable Health and Data Polling
 -
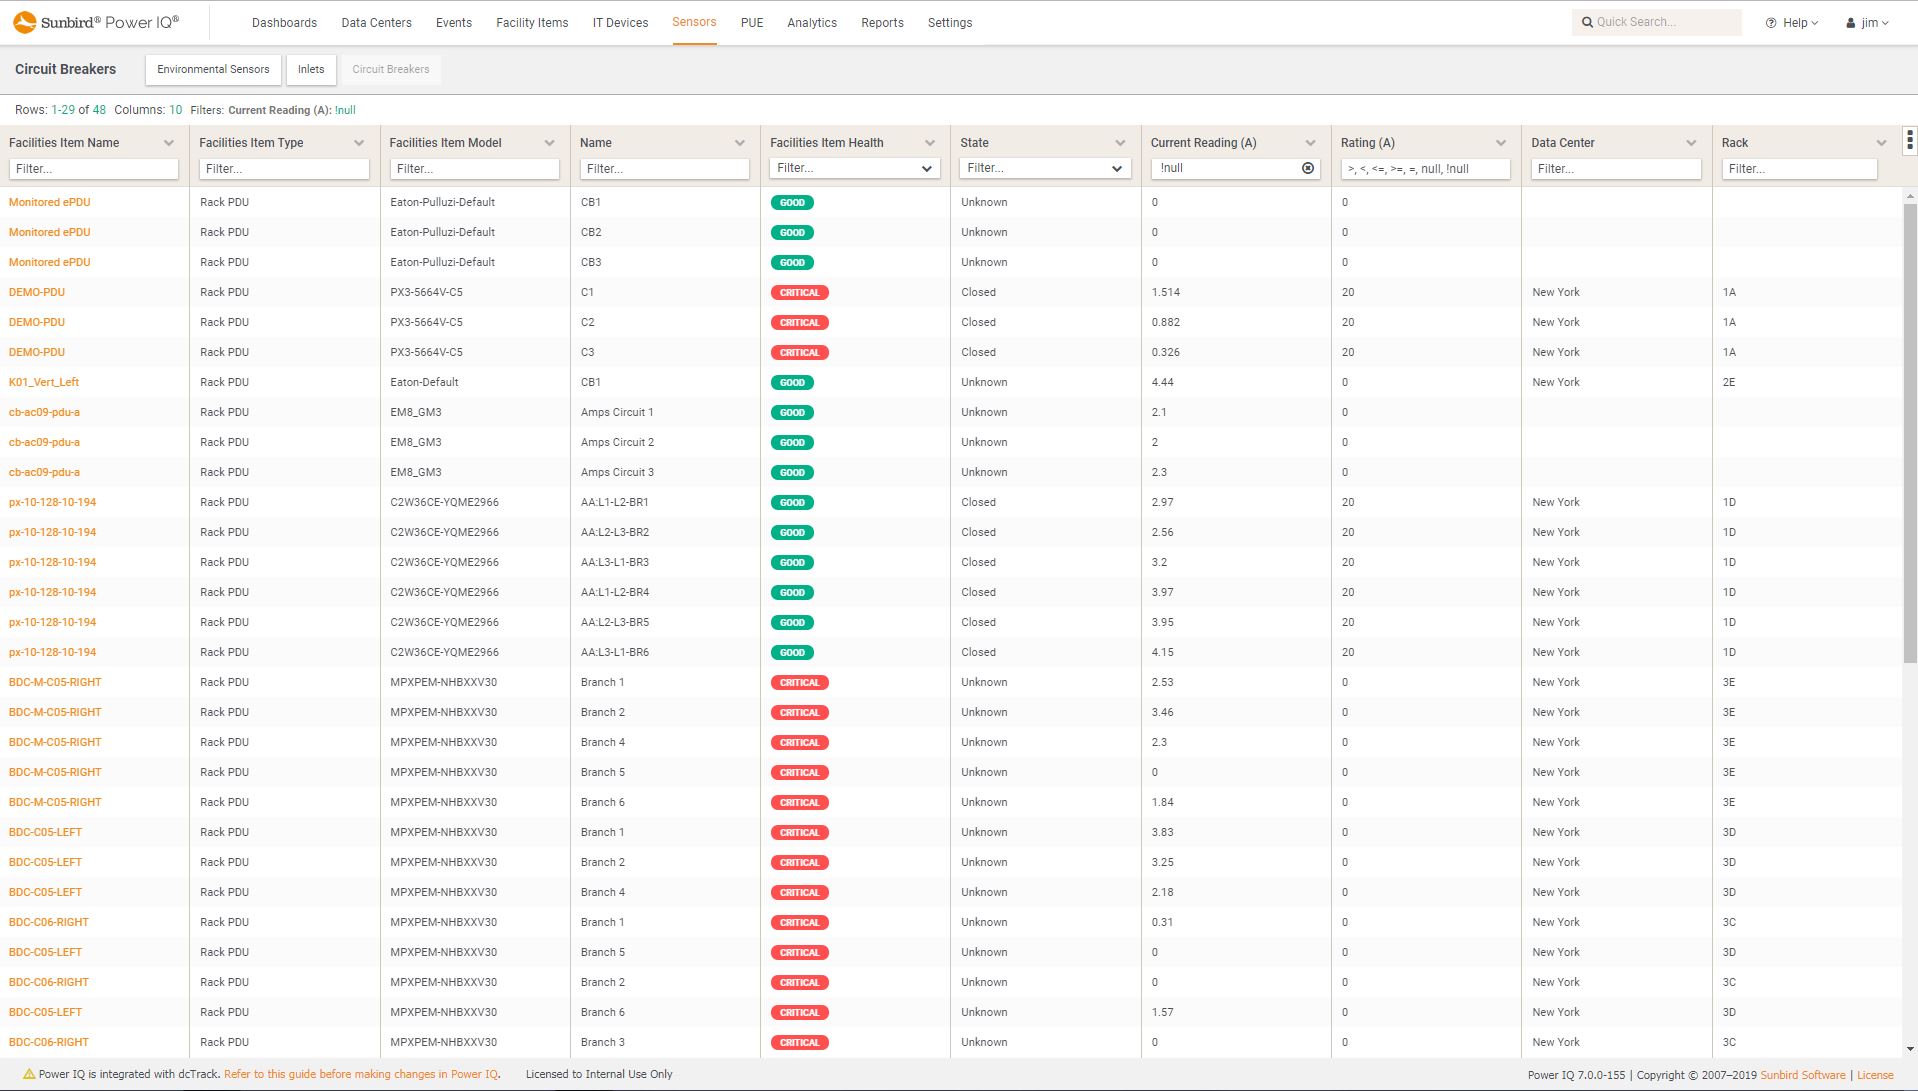
 Power IQ DCIM Monitoring | Power ManagementCircuit Breaker Status Report
 -
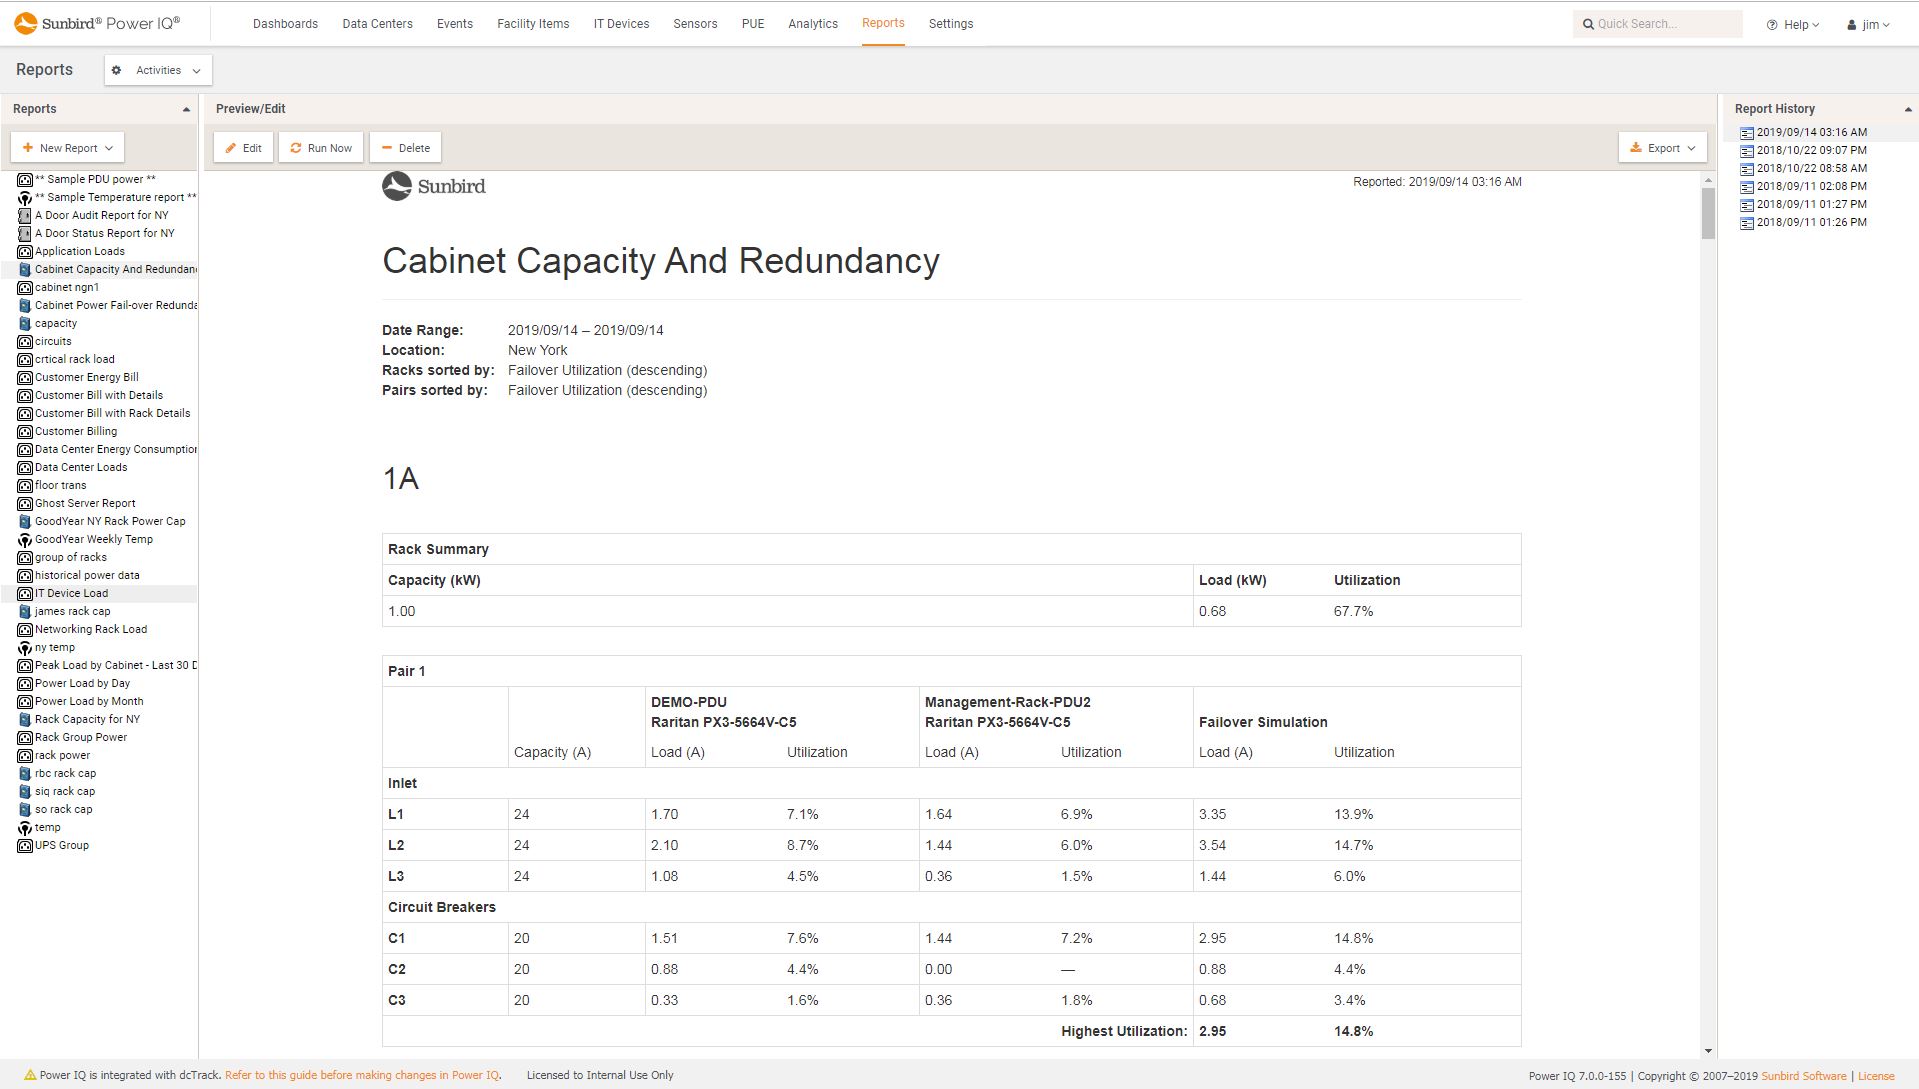
 Power IQ DCIM Monitoring | Power Management | Capacity ManagementCabinet Capacity and Redundancy Report
 -
 Power IQ DCIM Monitoring | Power Management3 Phase Power Balancing Report
 -
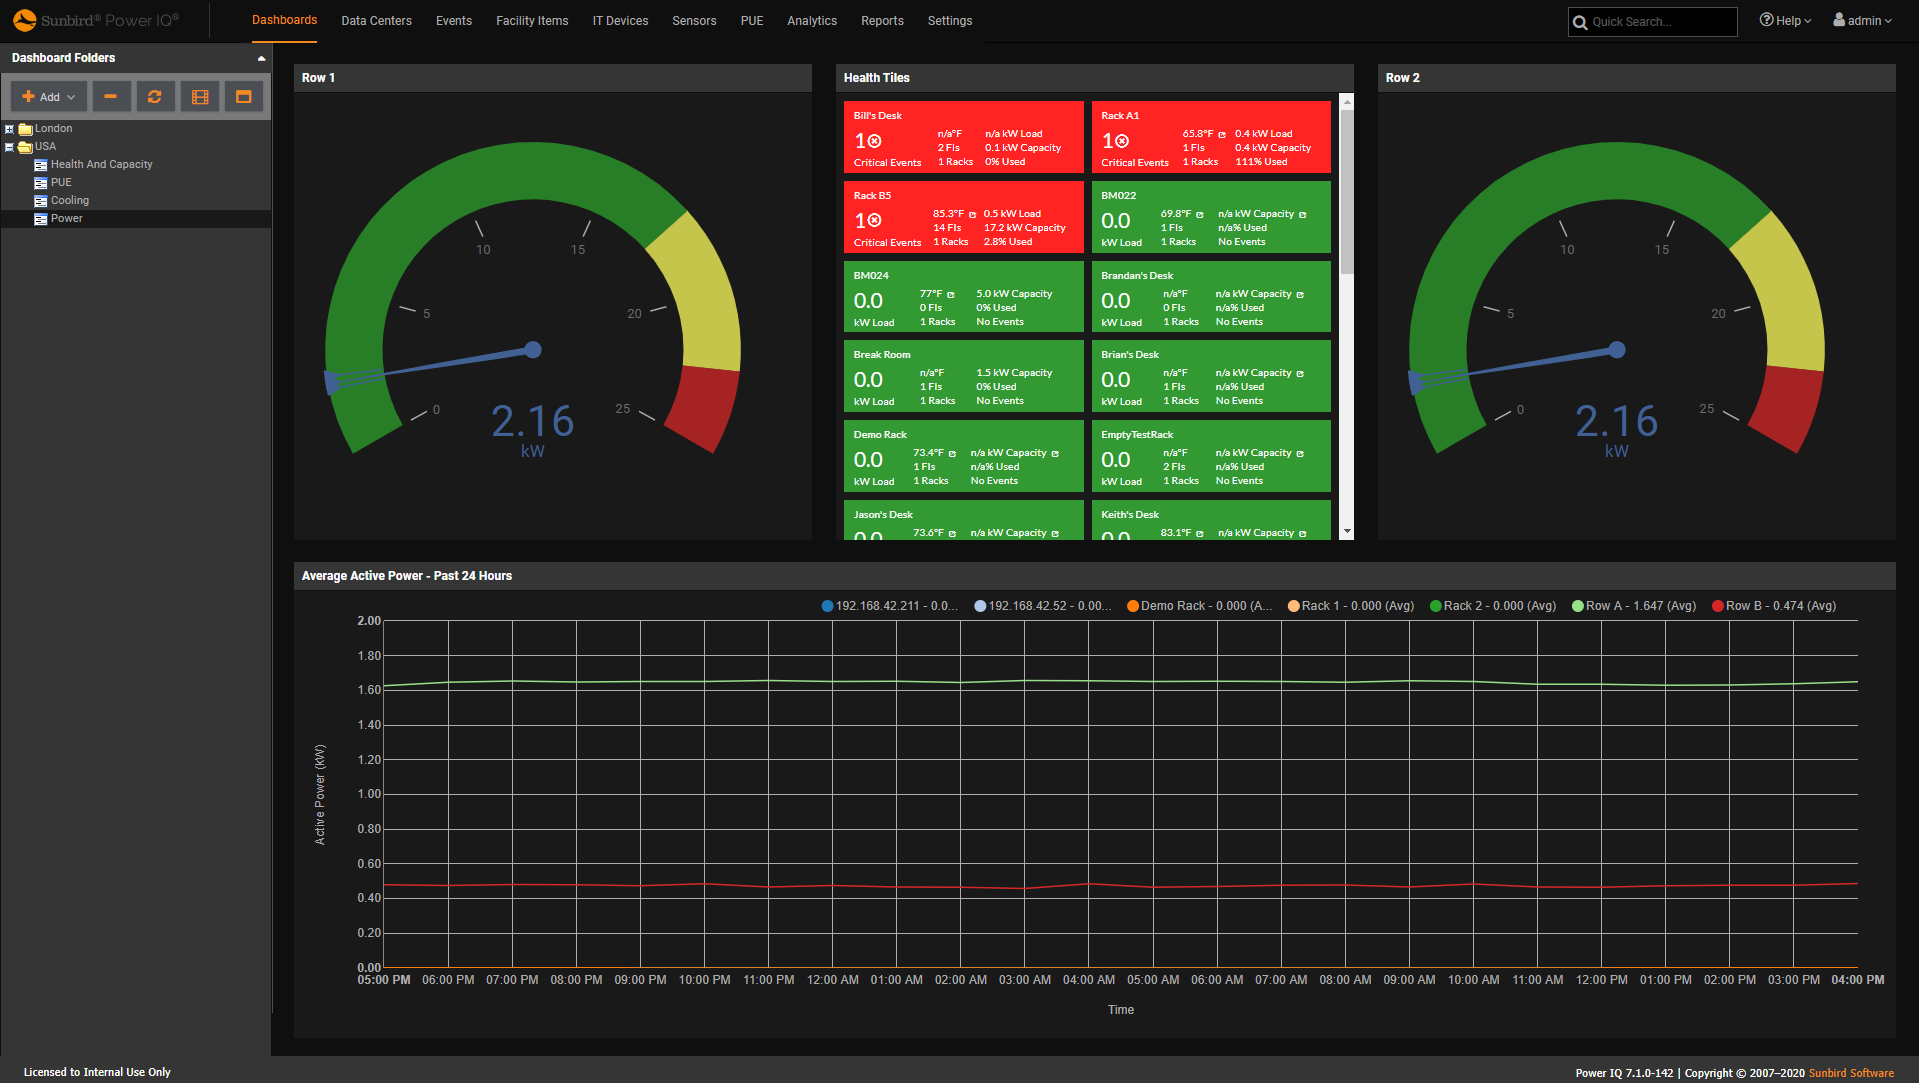
 Power IQ DCIM Monitoring | Capacity Management | DashboardsHealth and Capacity Widgets
 -
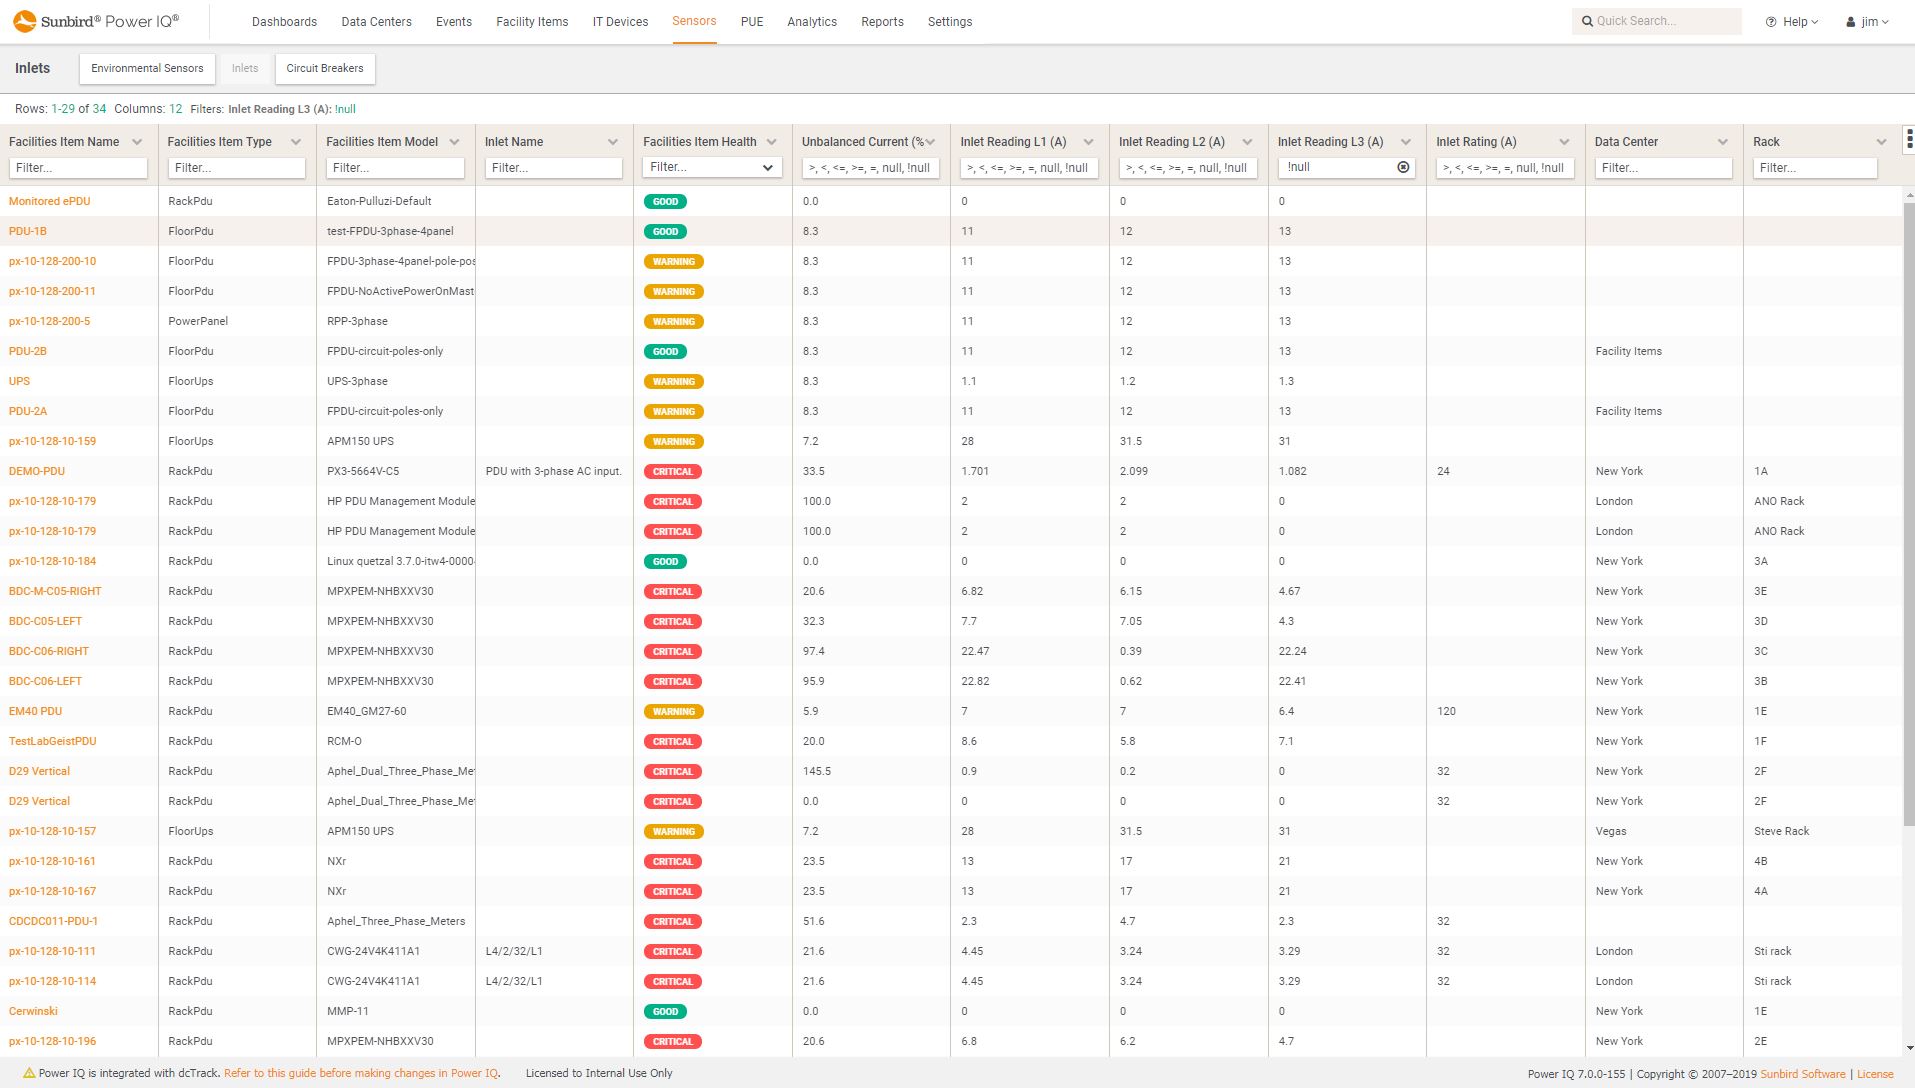
 Power IQ DCIM Monitoring | Power Management | Environment Management | Energy ManagementSensor List
 -
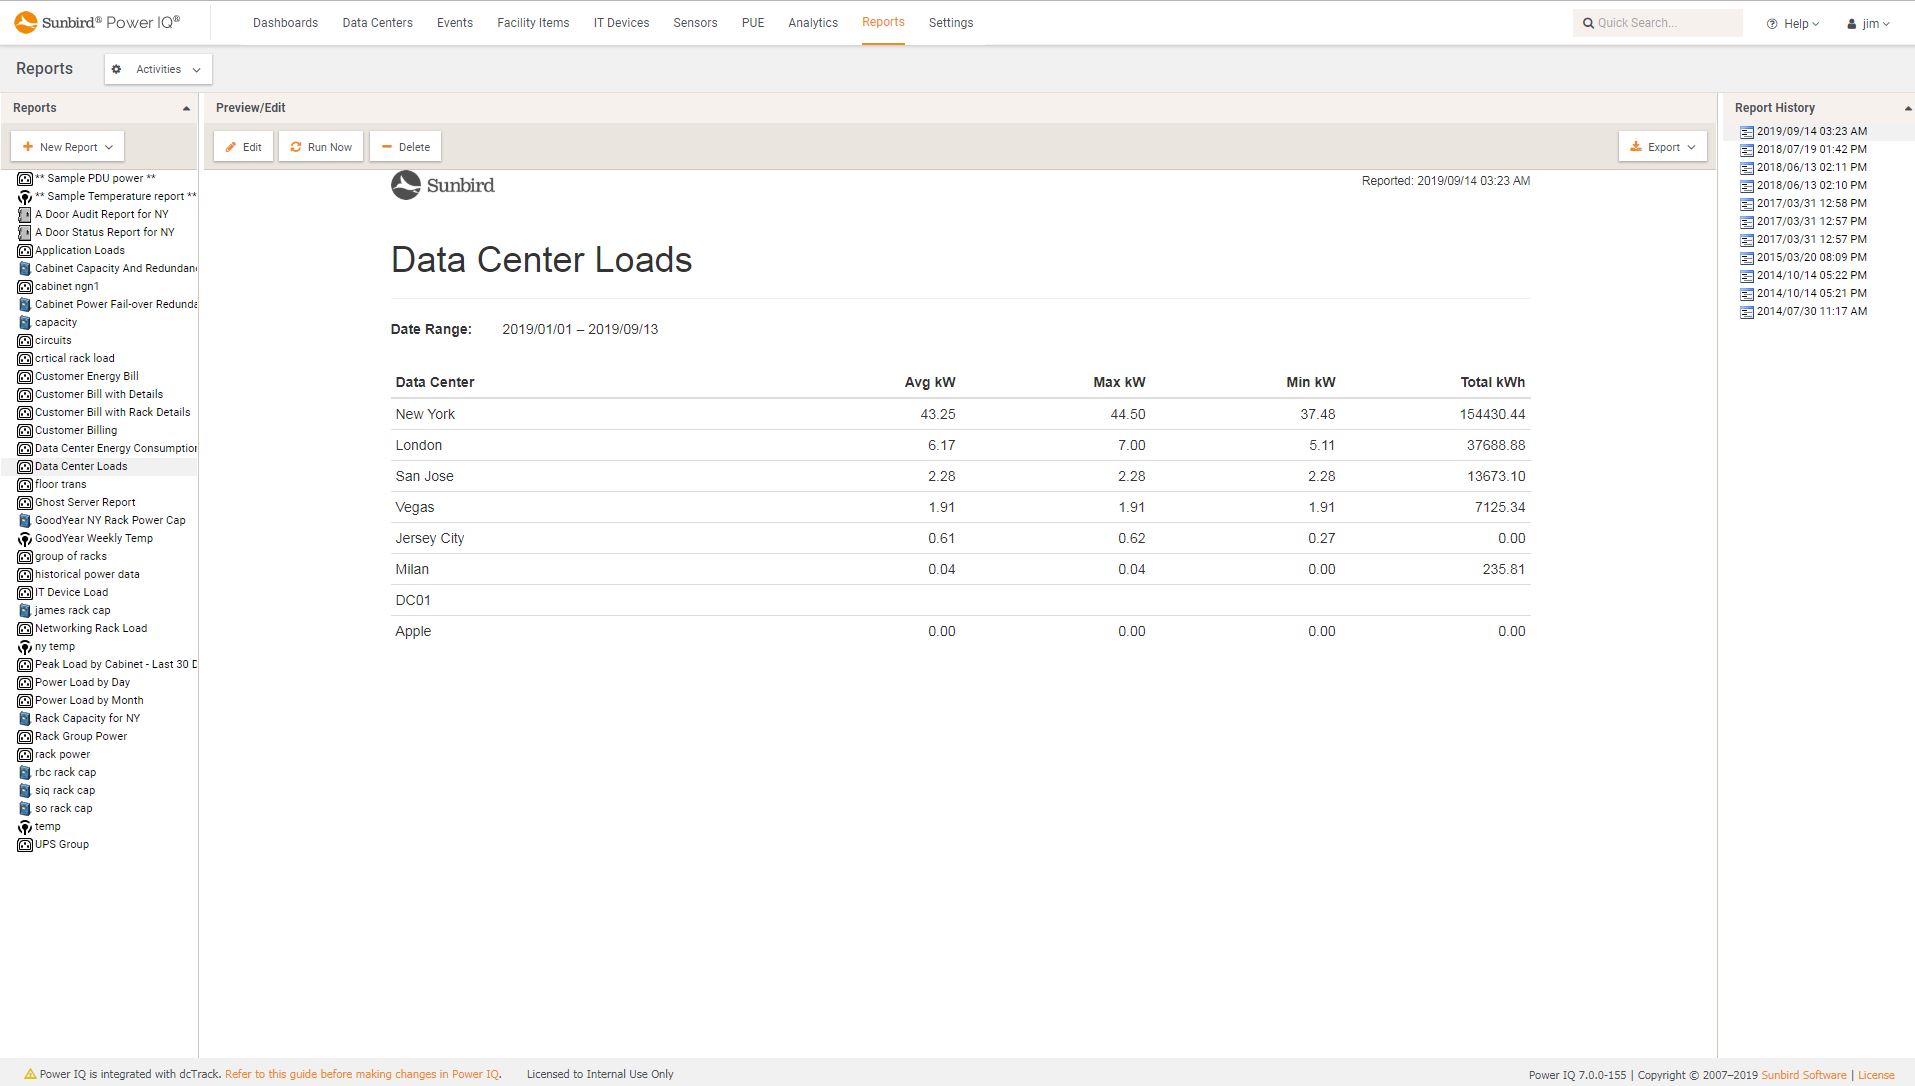
 Power IQ DCIM Monitoring | Energy Management | BI & Data AnalyticsData Center Energy and Loads
 -
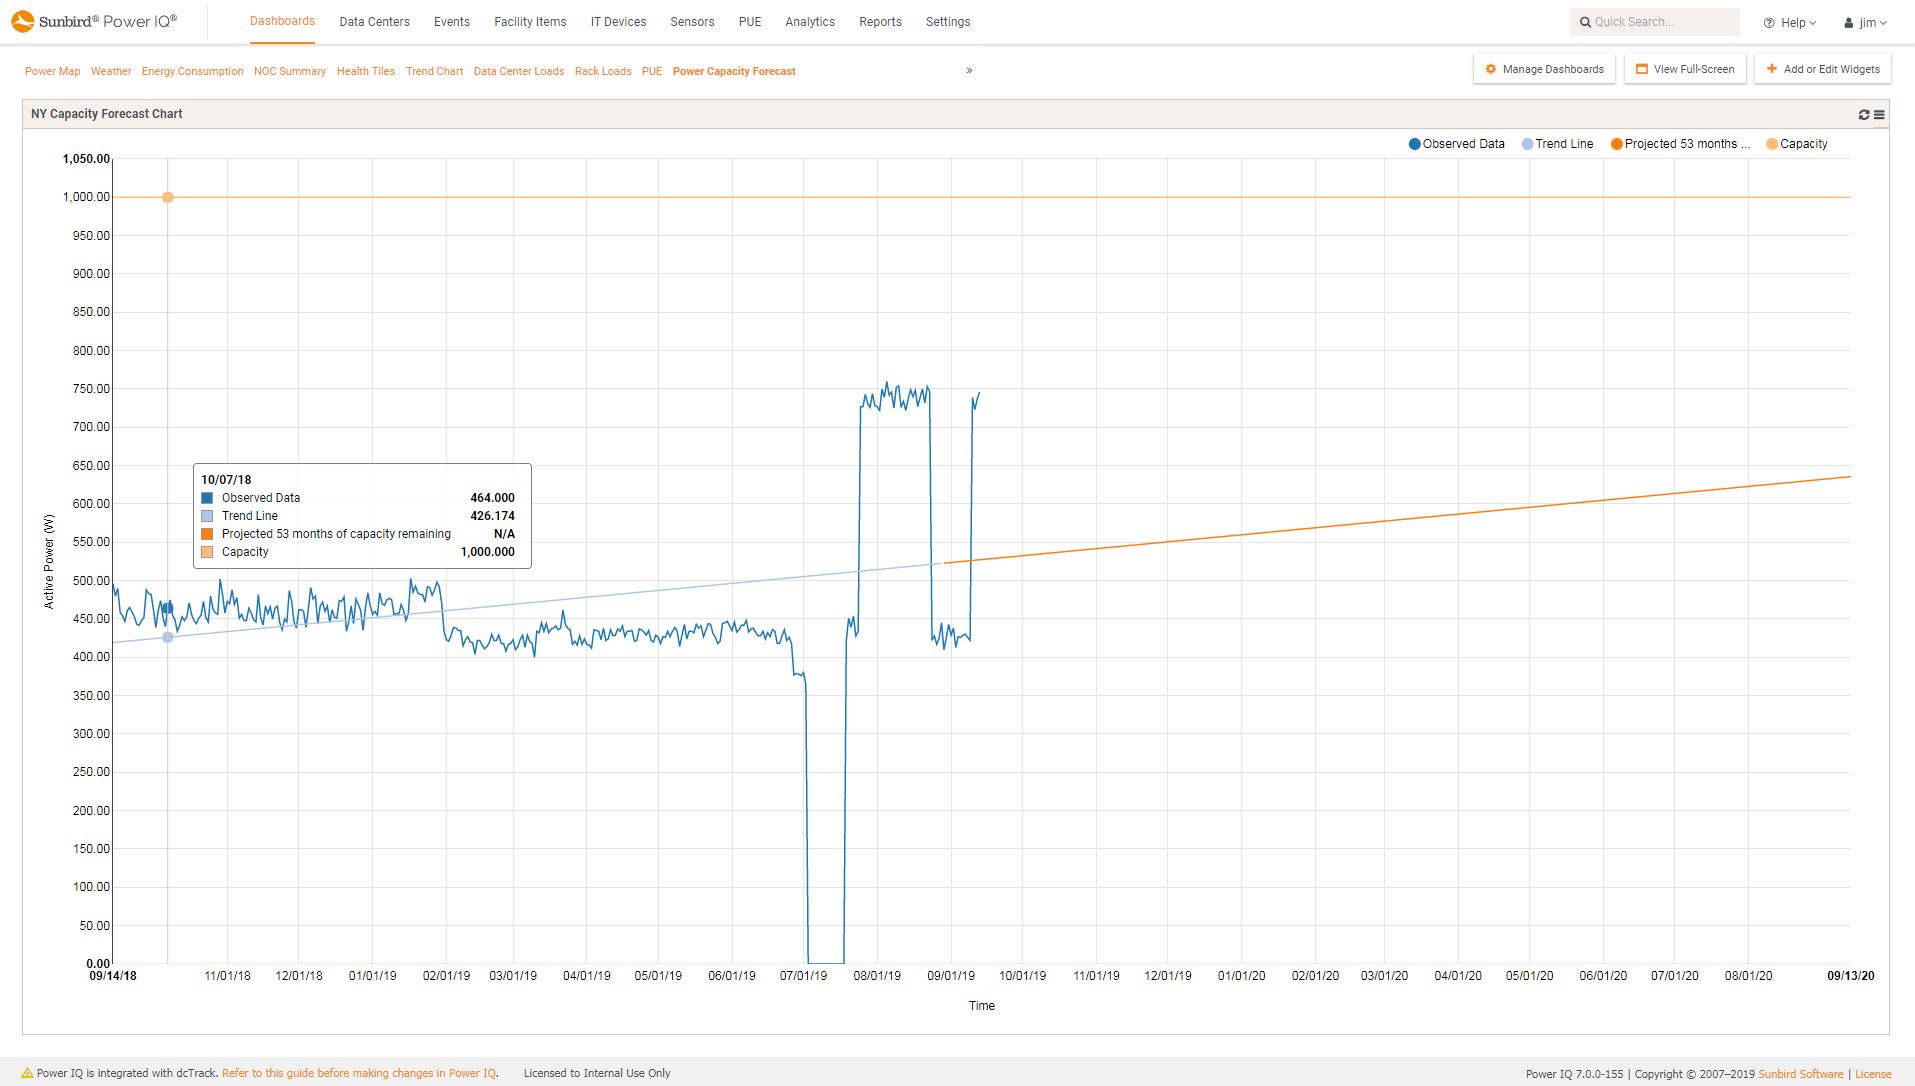
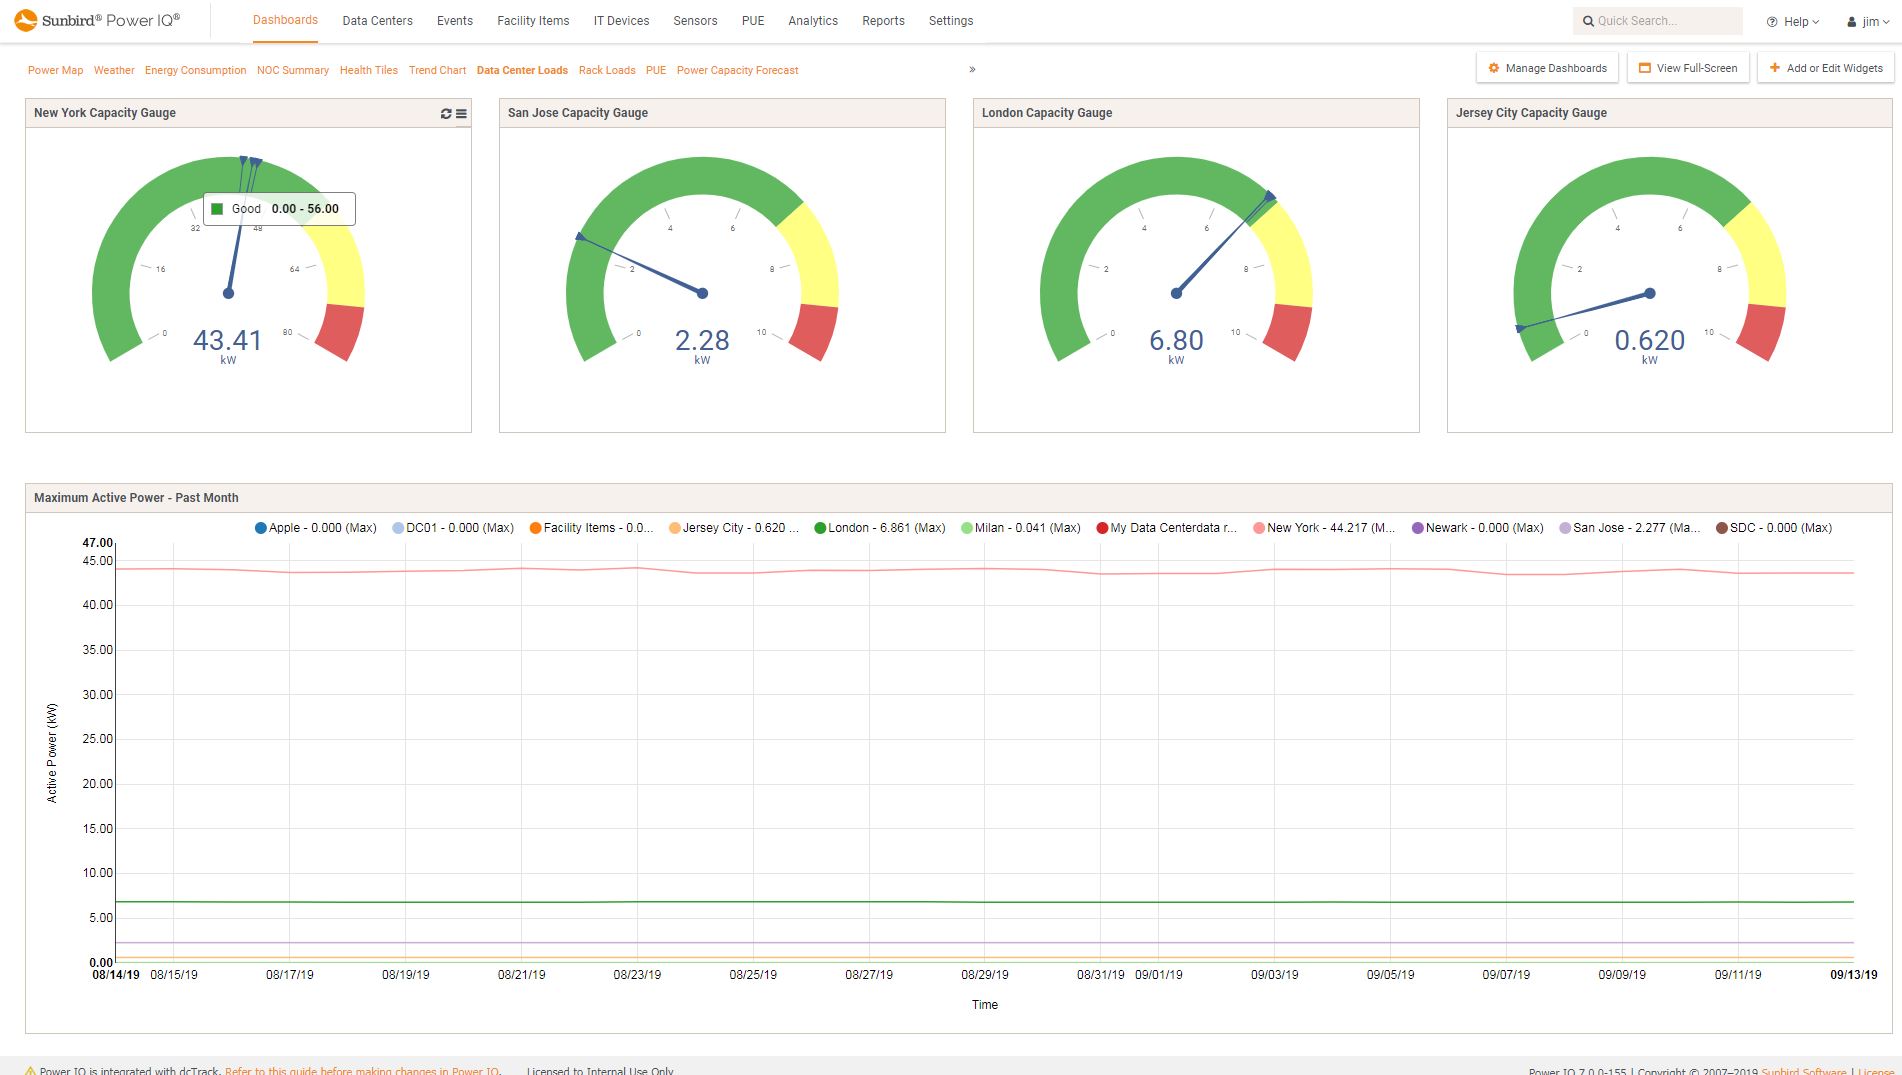
 Power IQ DCIM Monitoring | Power Management | Capacity Management | BI & Data AnalyticsProjected Days of Power Capacity Remaining
 -
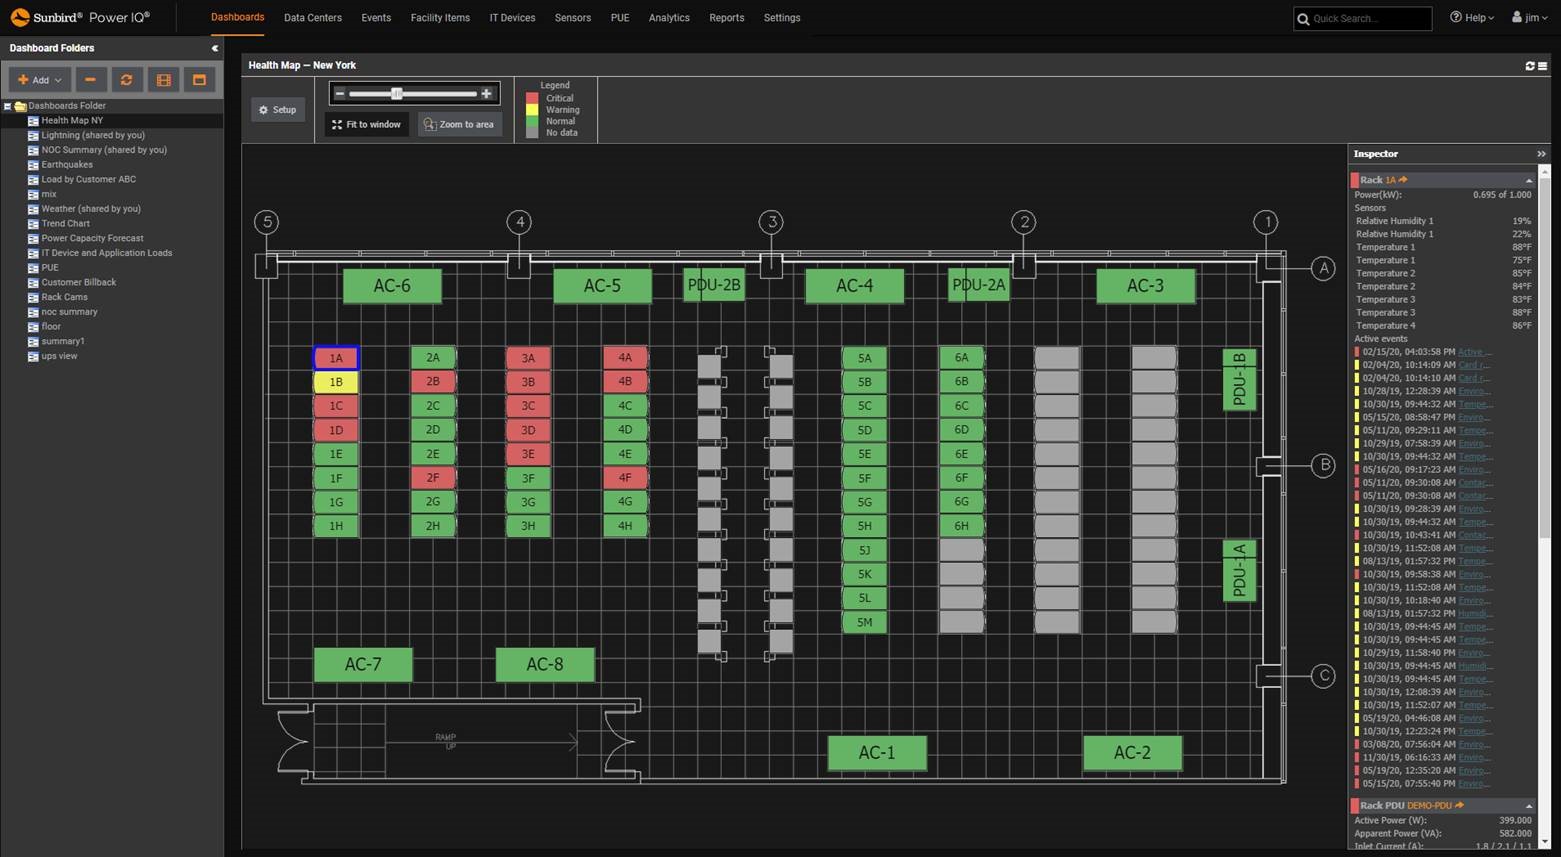
 Power IQ DCIM Monitoring | Power Management | Environment Management | BI & Data Analytics | VisualizationHealth and Capacity Floor Map with Cabinet Inspector
 -
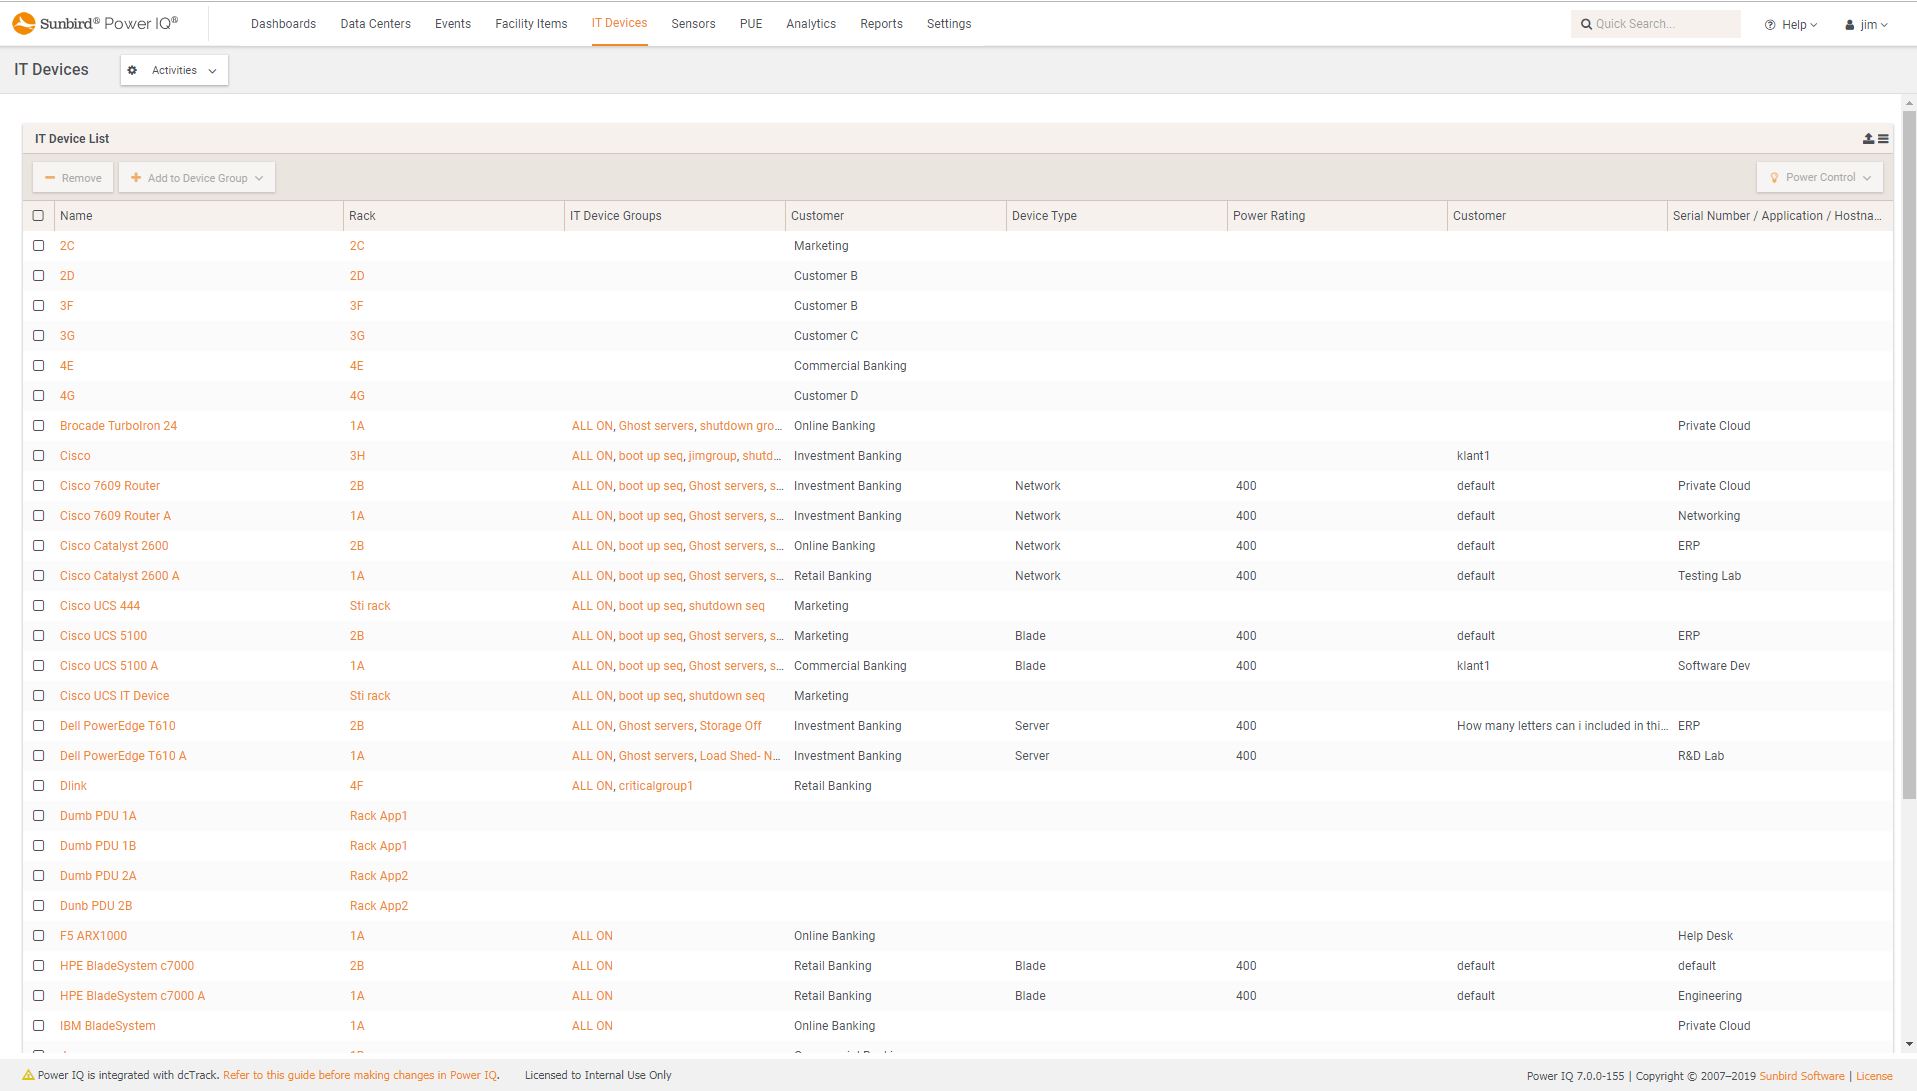
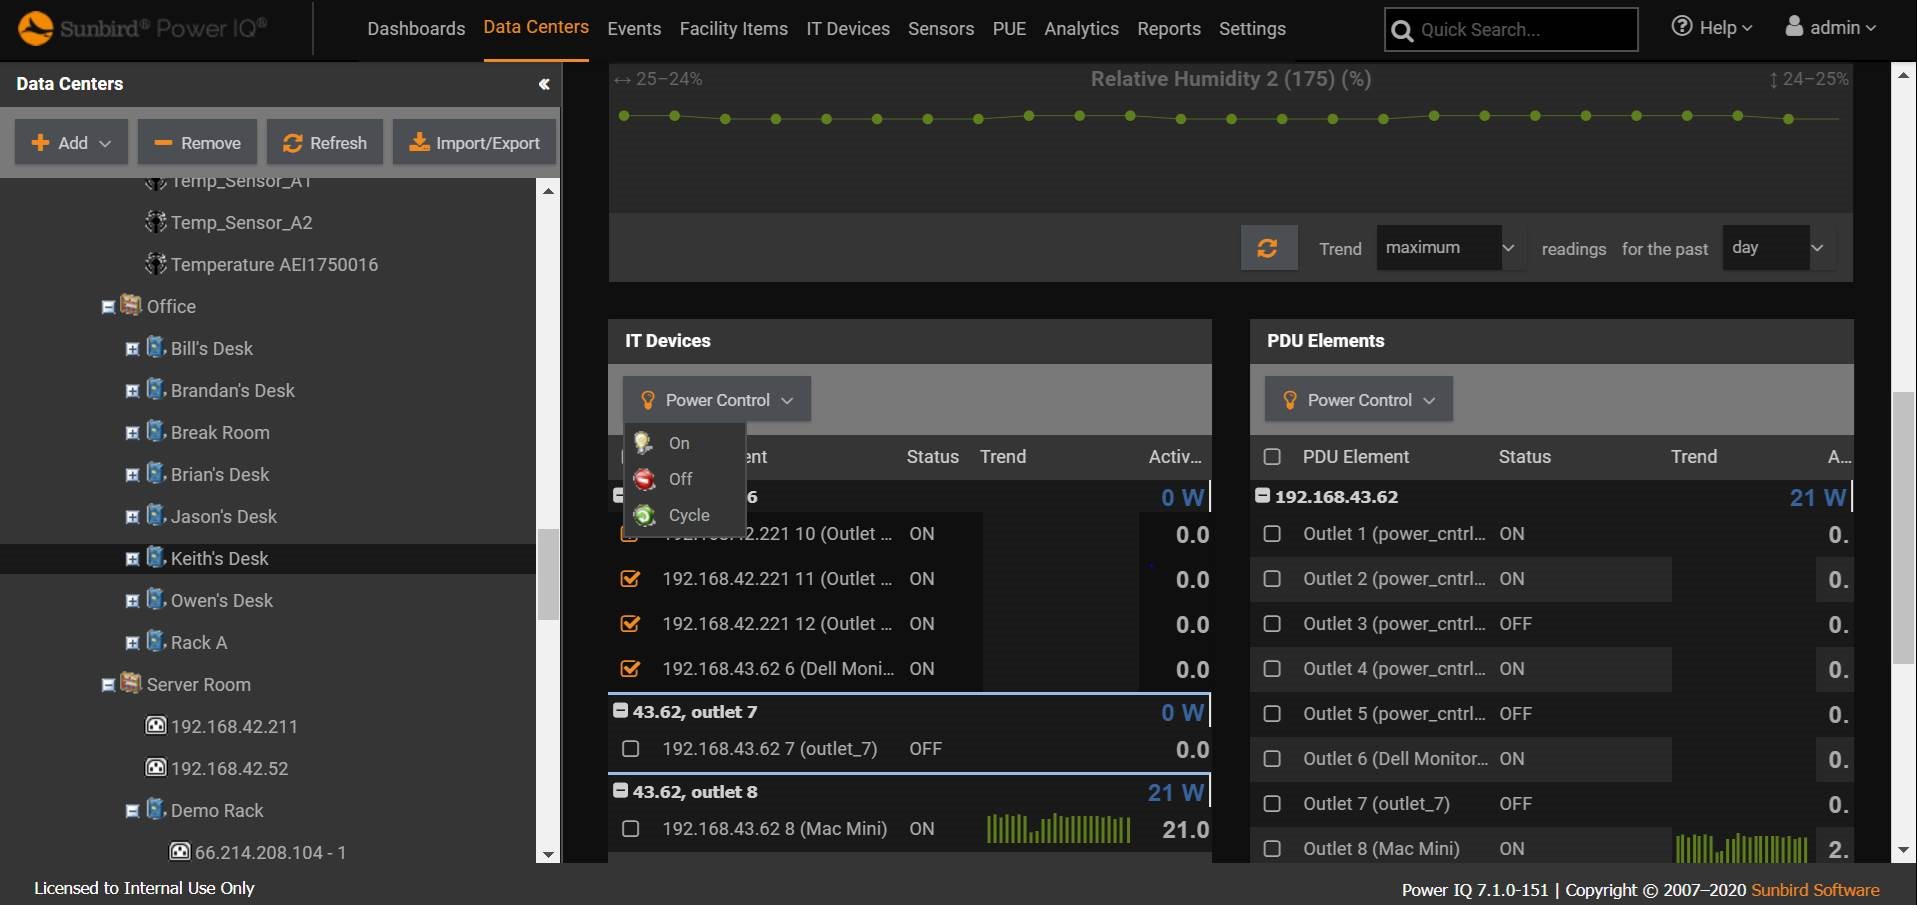
 Power IQ DCIM Monitoring | Asset ManagementIT Device Groups Power Control
 -
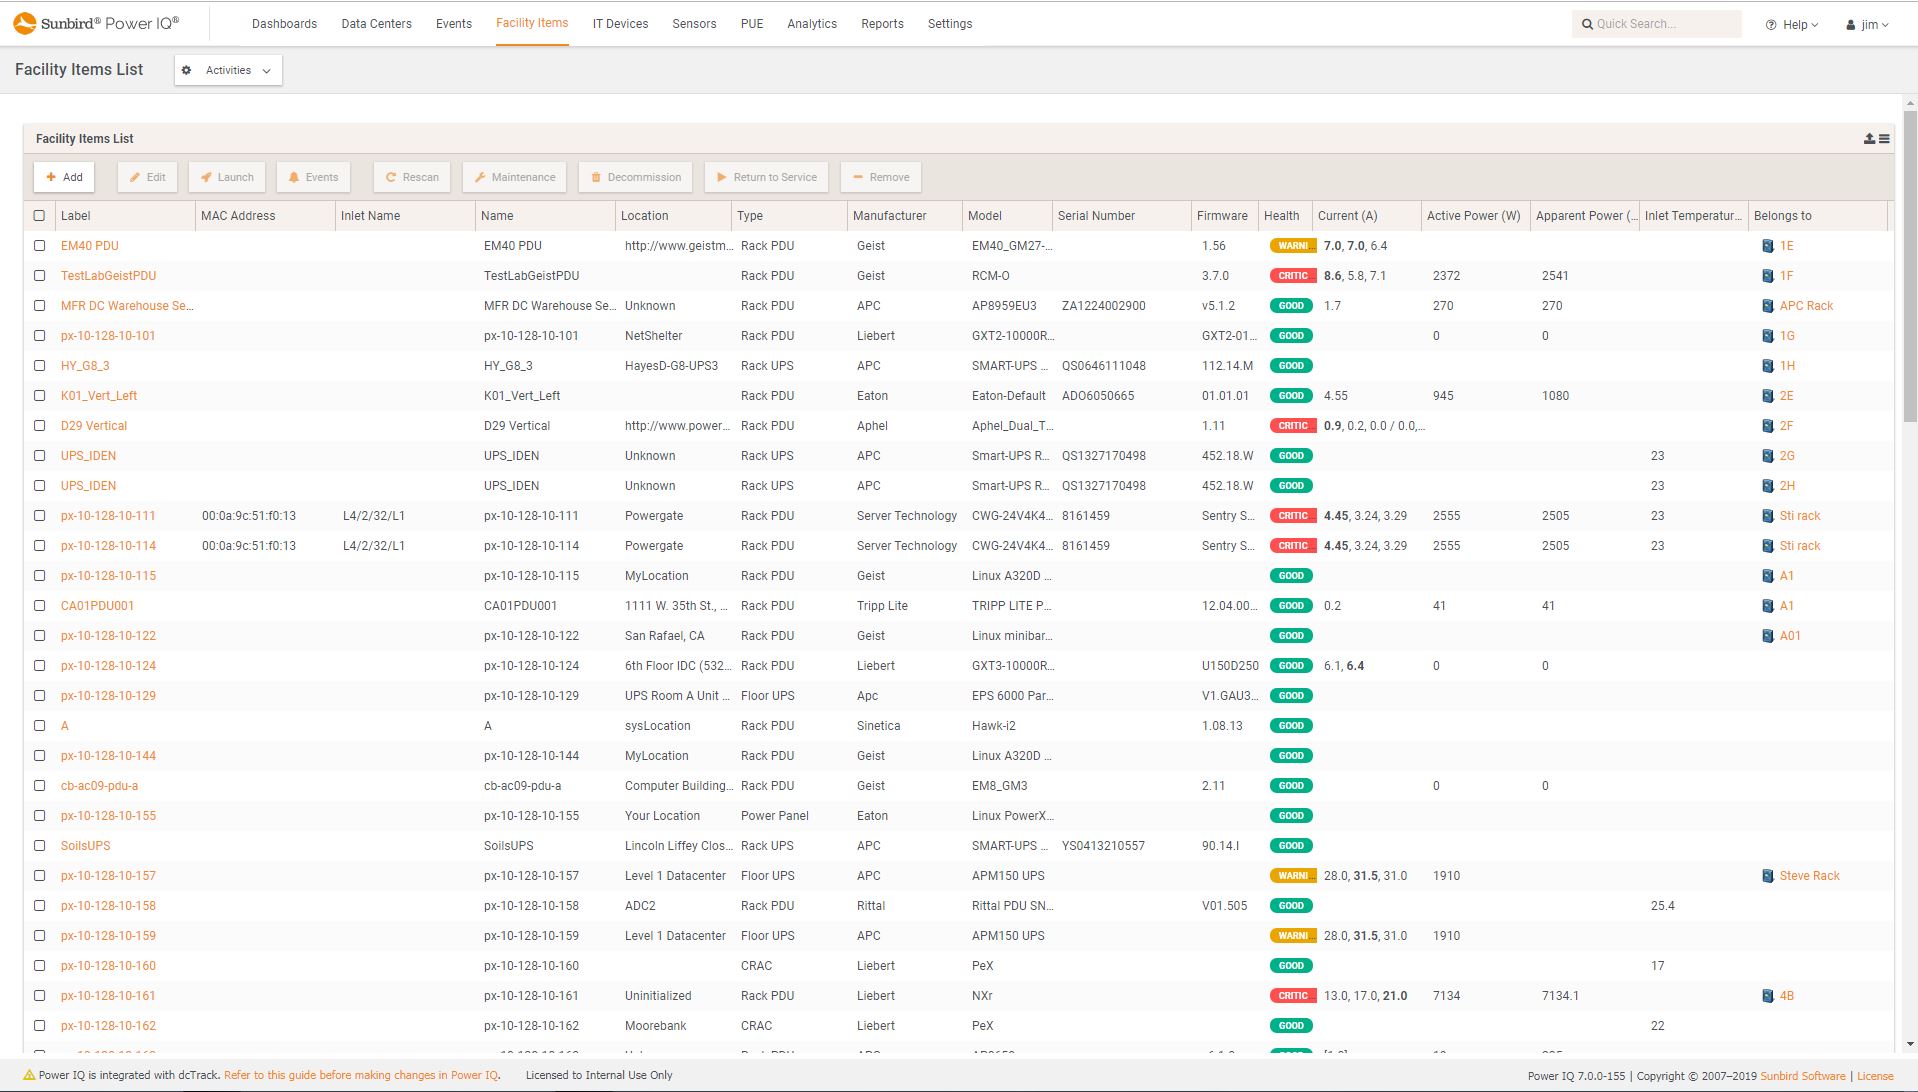
 Power IQ DCIM Monitoring | Asset ManagementFacility Items List
 -
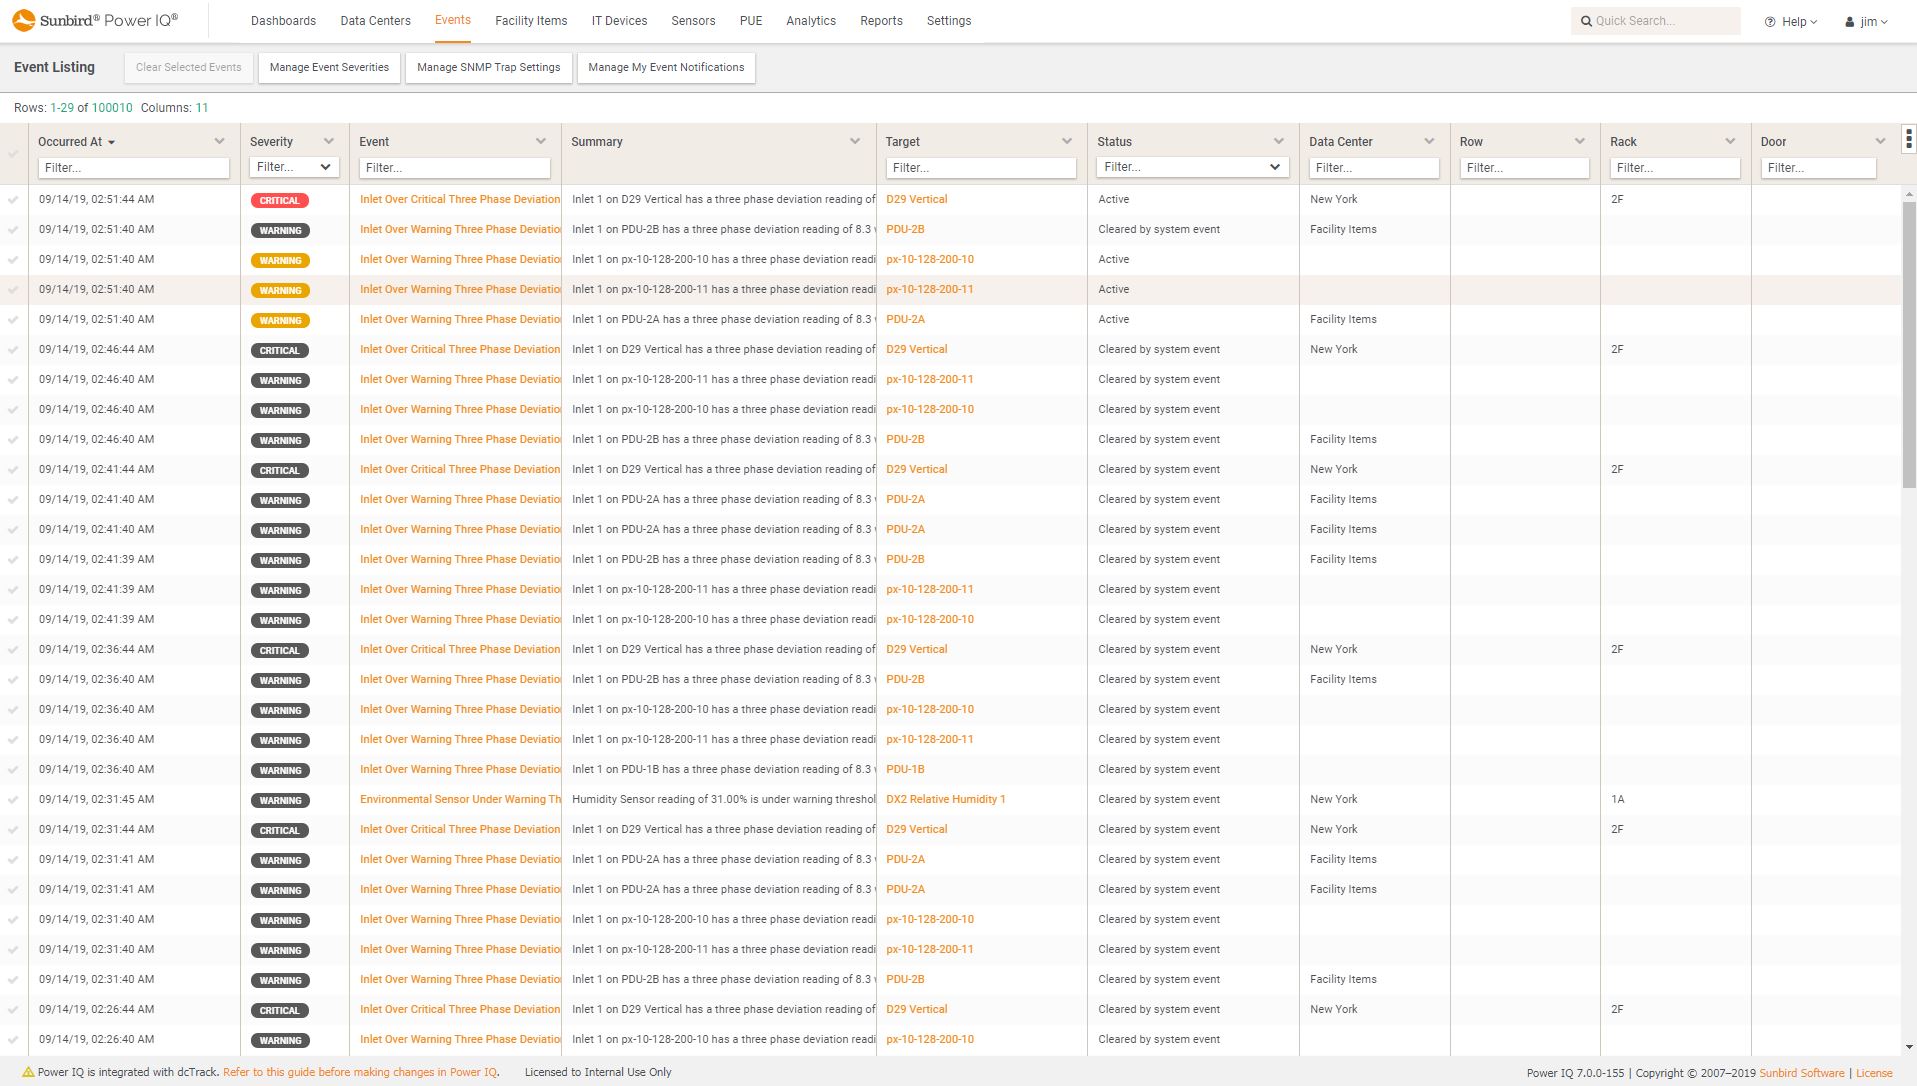
 Power IQ DCIM Monitoring | Power Management | Environment ManagementAlarm List
 -
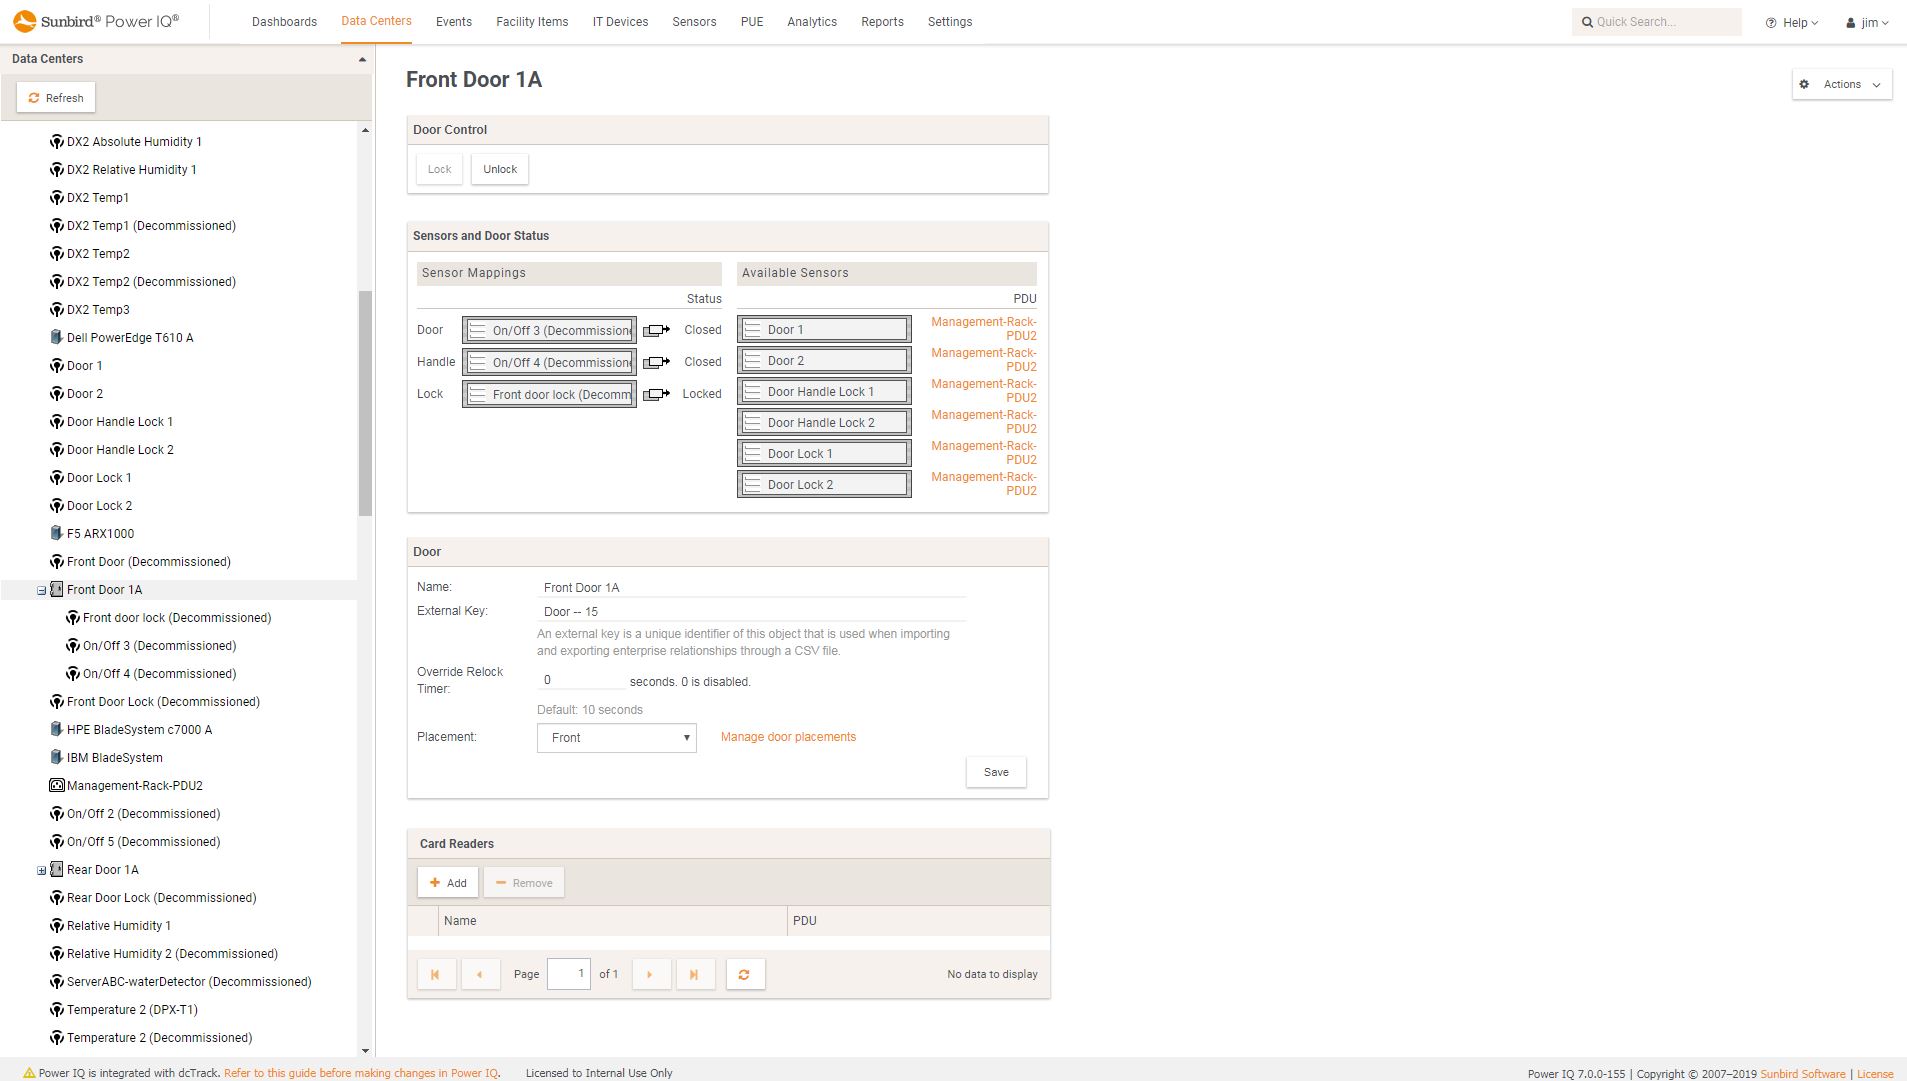
 Power IQ DCIM Monitoring | SecurityDoor Status and Electronic Lock Control
 -
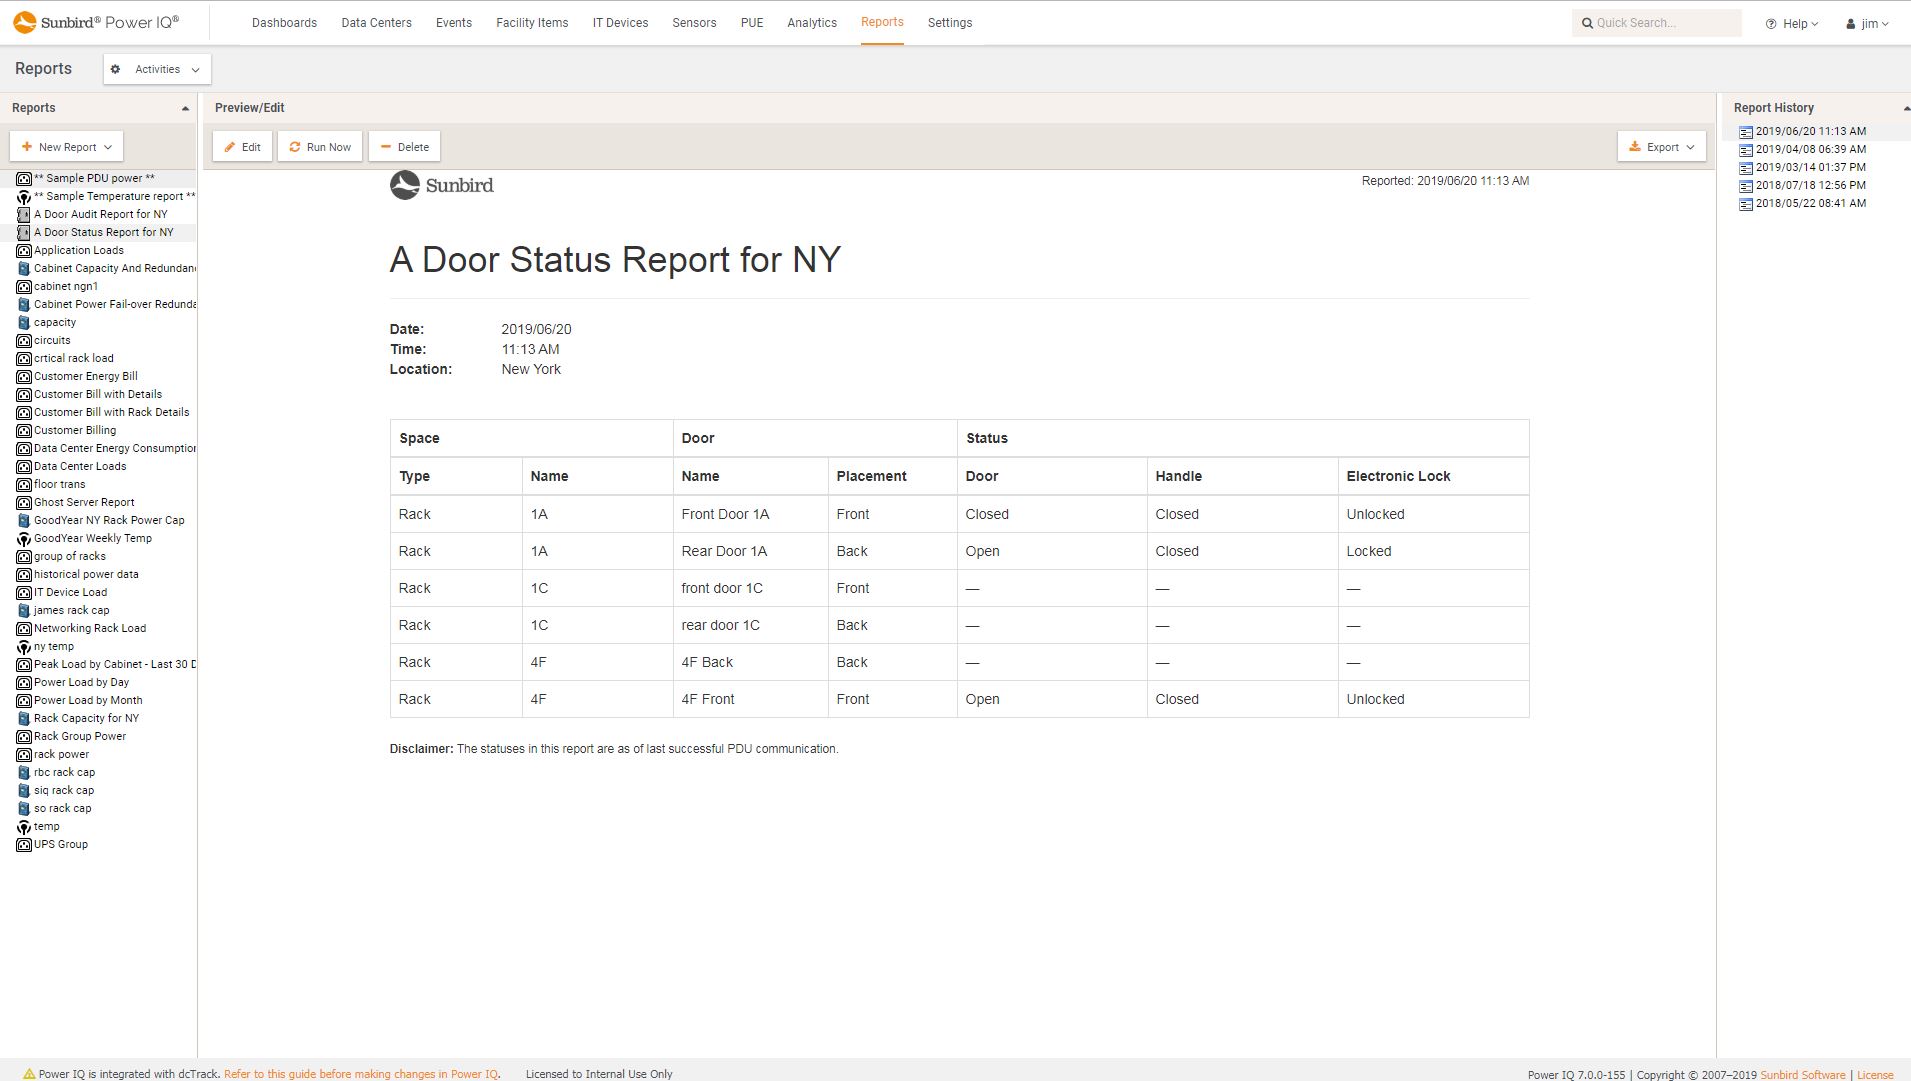
 Power IQ DCIM Monitoring | SecurityElectronic Door Status Report
 -
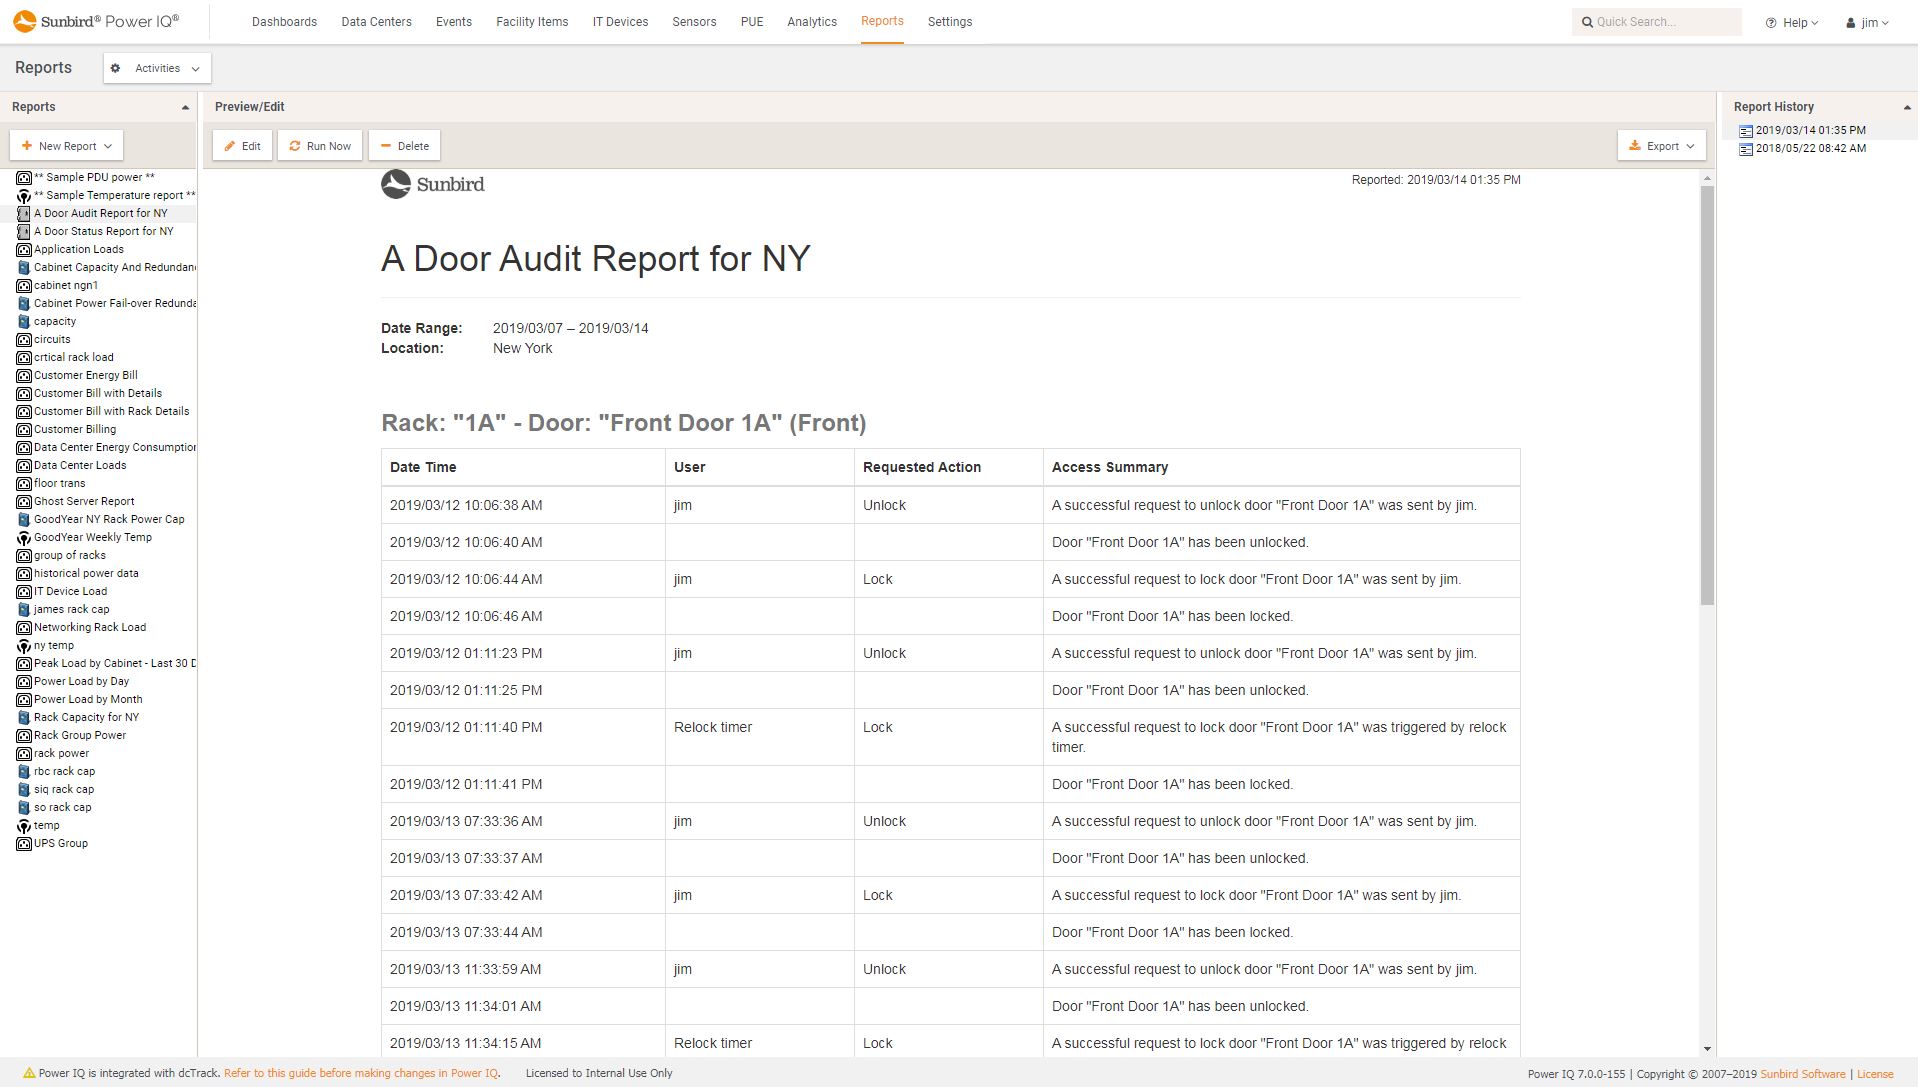
 Power IQ DCIM Monitoring | Security | BI & Data AnalyticsElectronic Door Audit Report
 -
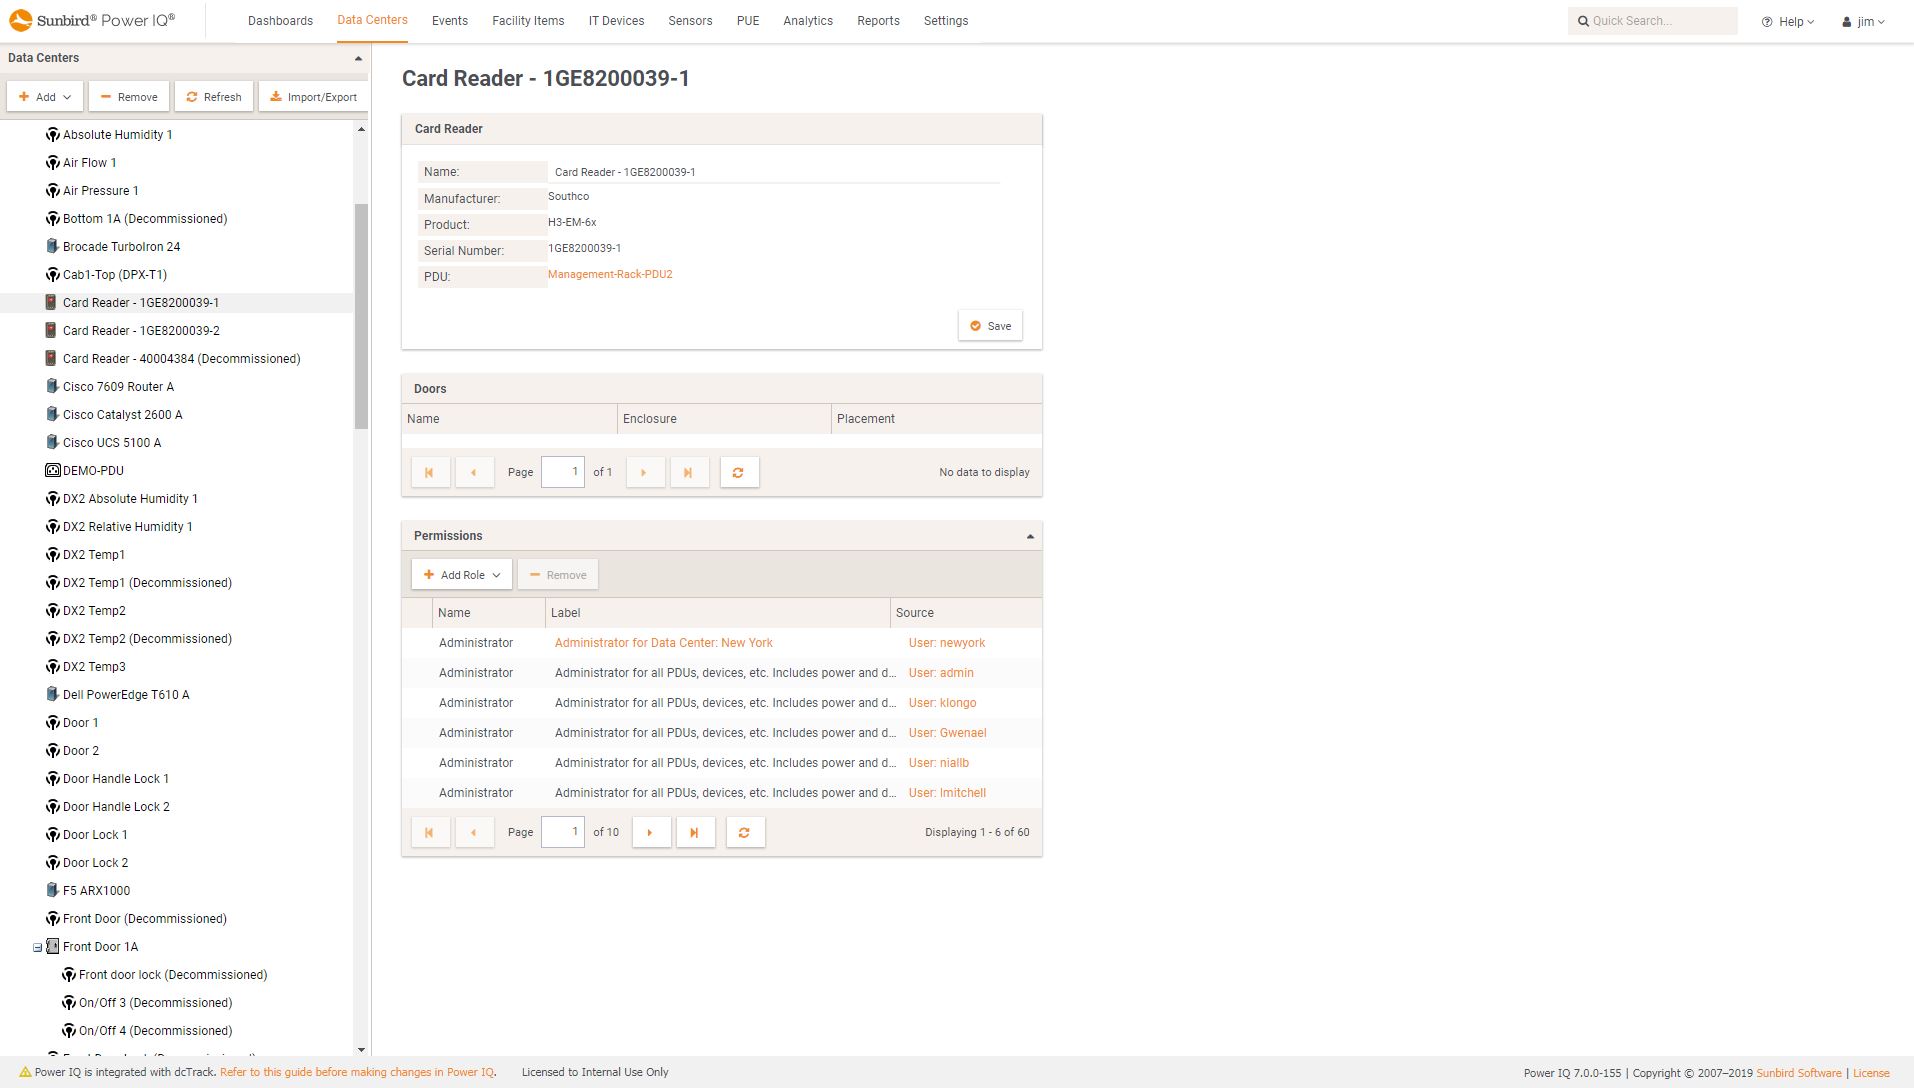
 Power IQ DCIM Monitoring | SecuritySmart Card Access
 -
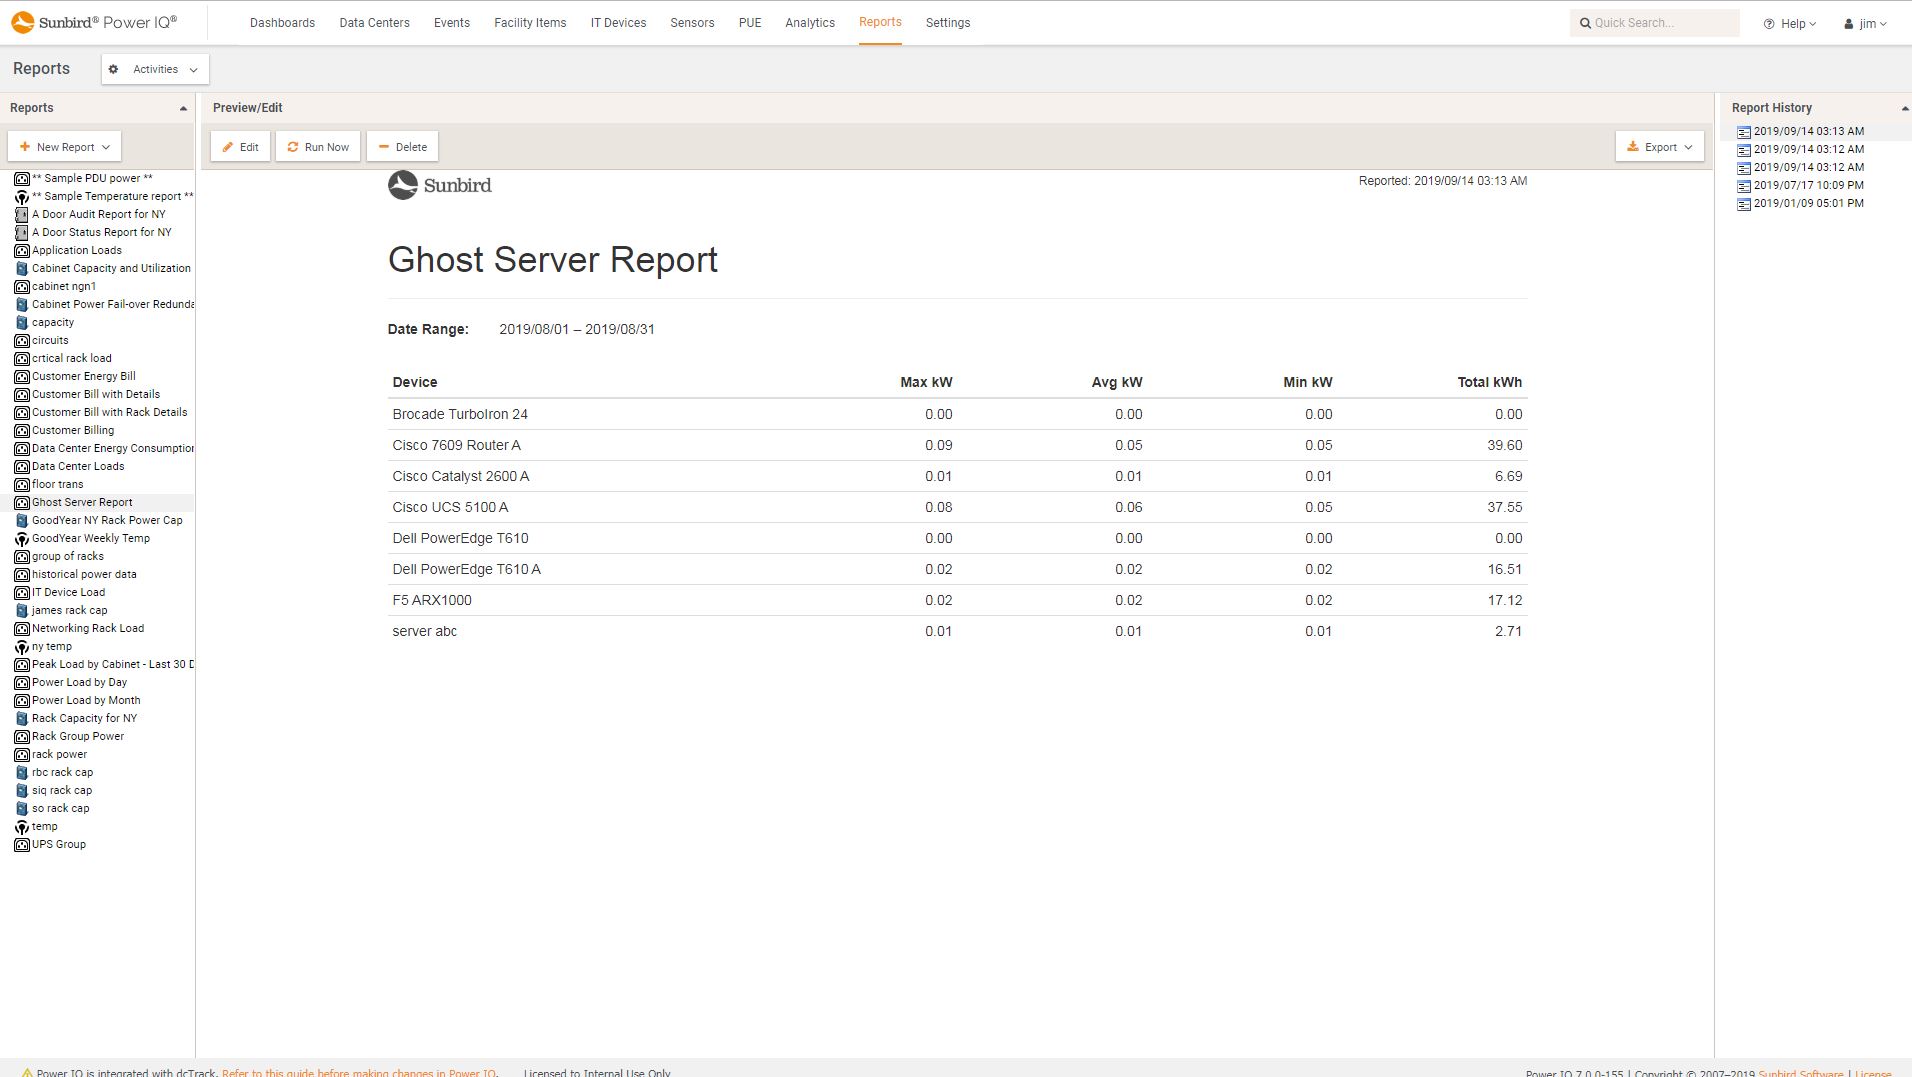
 Power IQ DCIM Monitoring | Power Management | Environment Management | Capacity ManagementGhost Server Report
 -
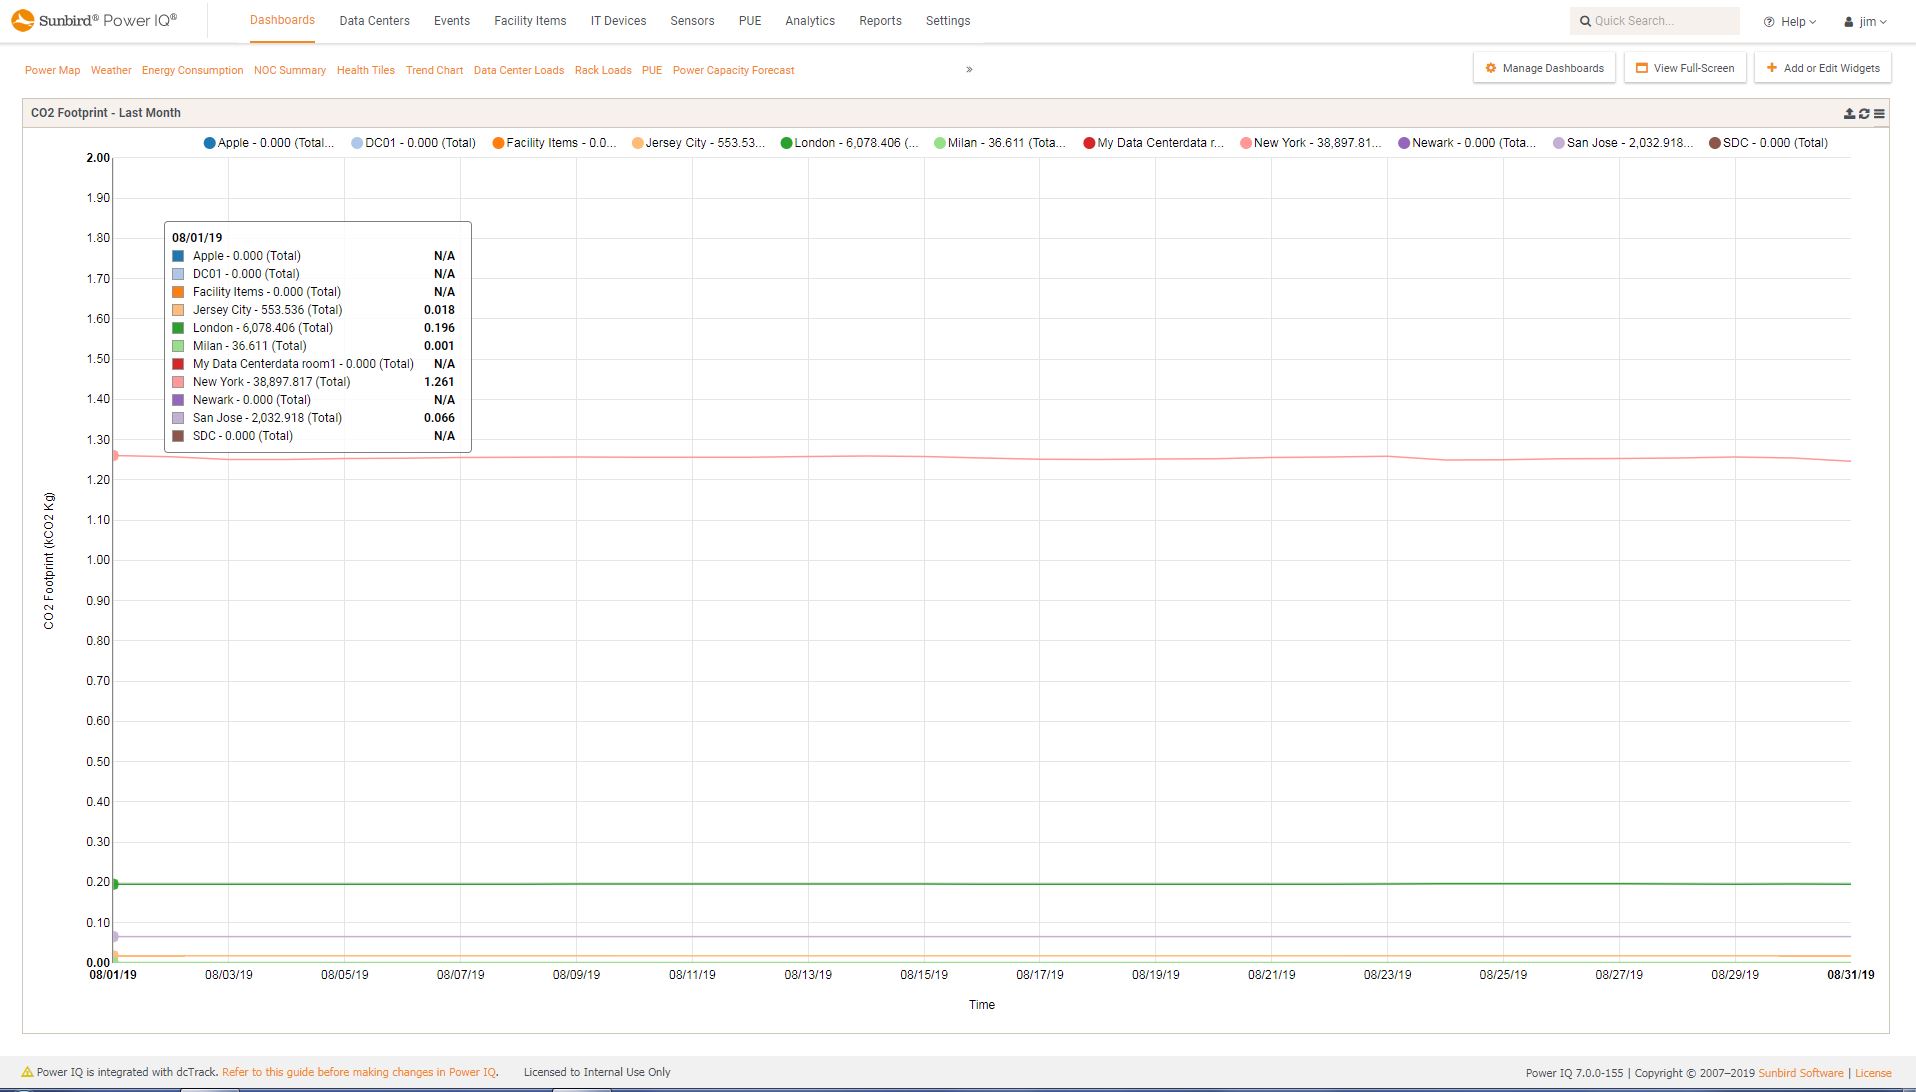
 Power IQ DCIM Monitoring | Environment ManagementCarbon Foot Print by Location
 -
 Power IQ DCIM Monitoring | Power Management | Capacity ManagementPower Capacity by Location
 -
 Power IQ DCIM Monitoring | Power ManagementRemote Power Control of Multi Power Supply Device
 -
 Power IQ DCIM Monitoring | Power Management | BI & Data AnalyticsPower Monitoring Dashboard
 -
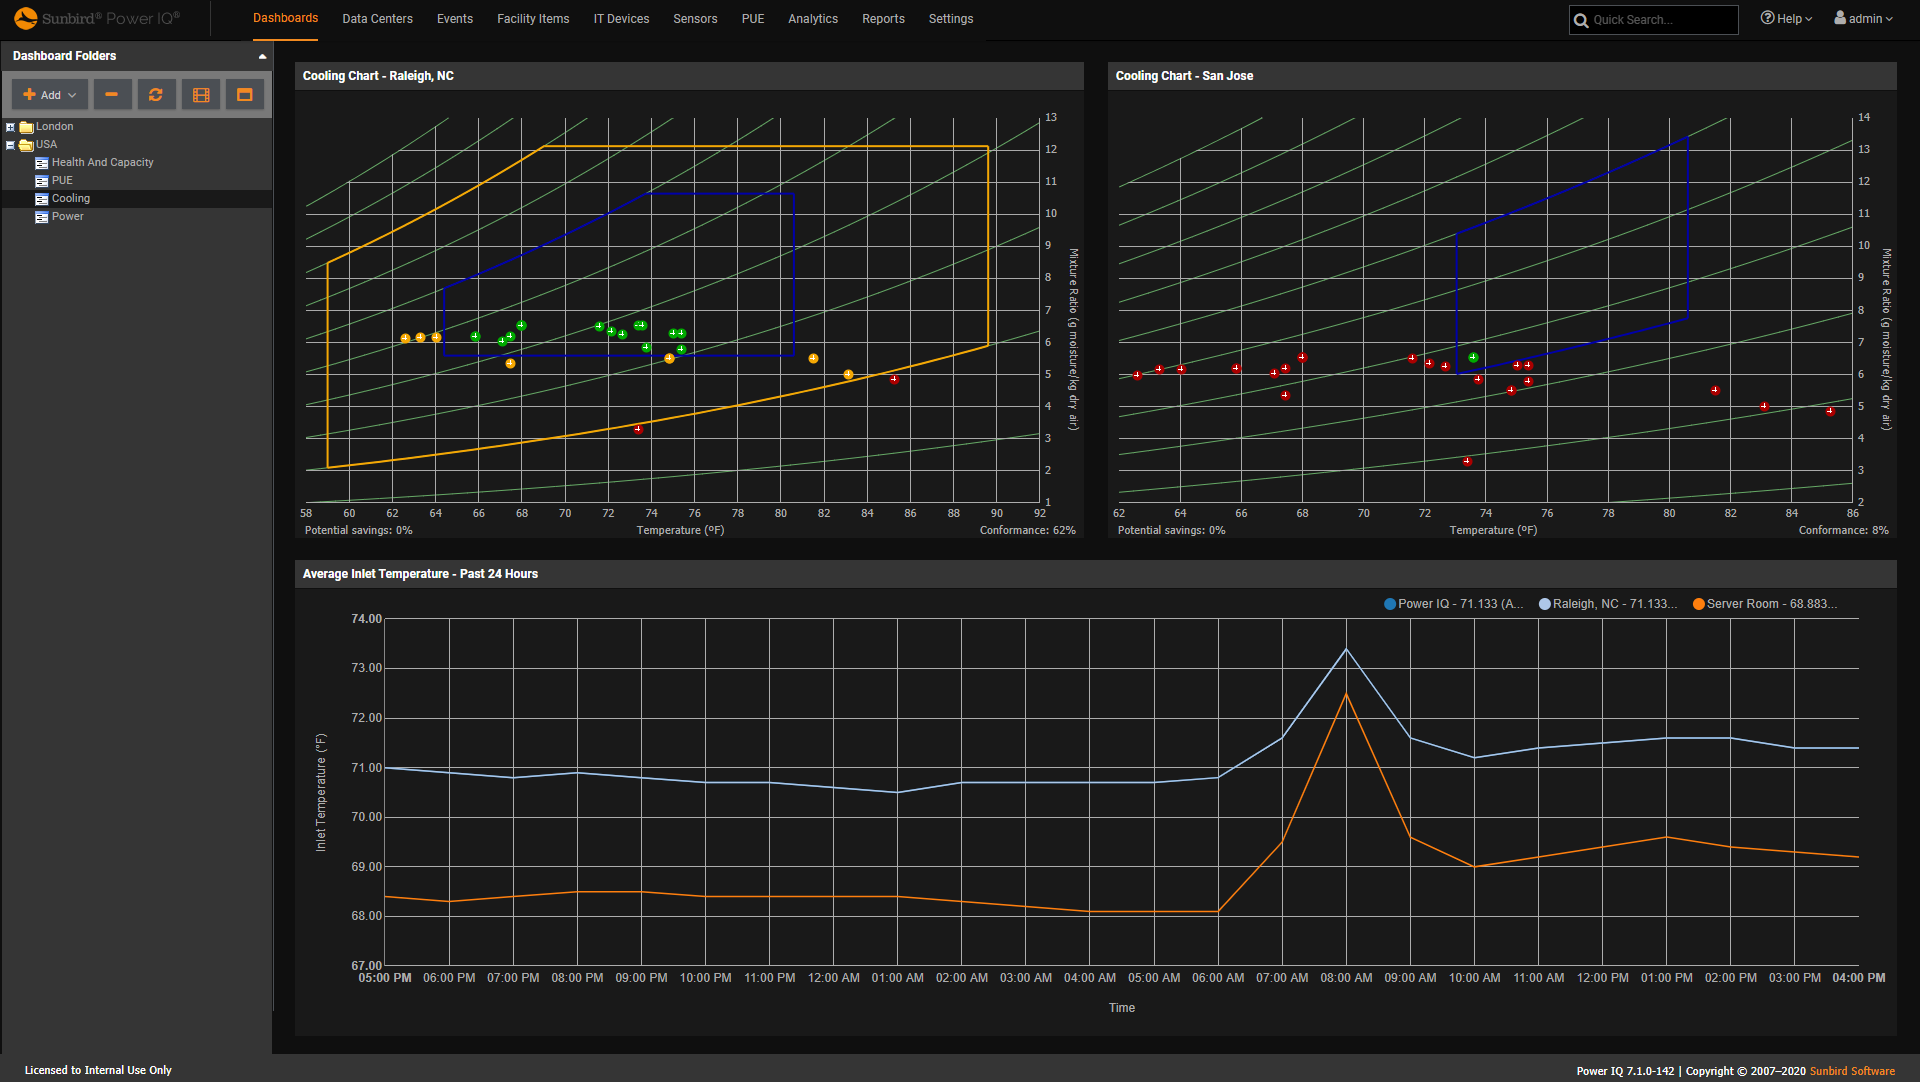
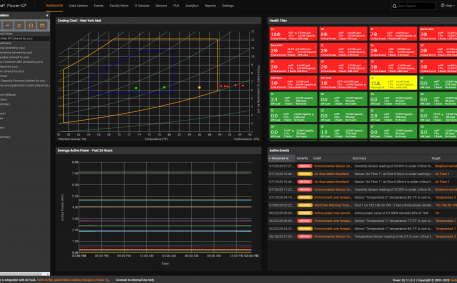
 Power IQ DCIM Monitoring | Environment Management | BI & Data AnalyticsASHRAE Cooling Charts
 -
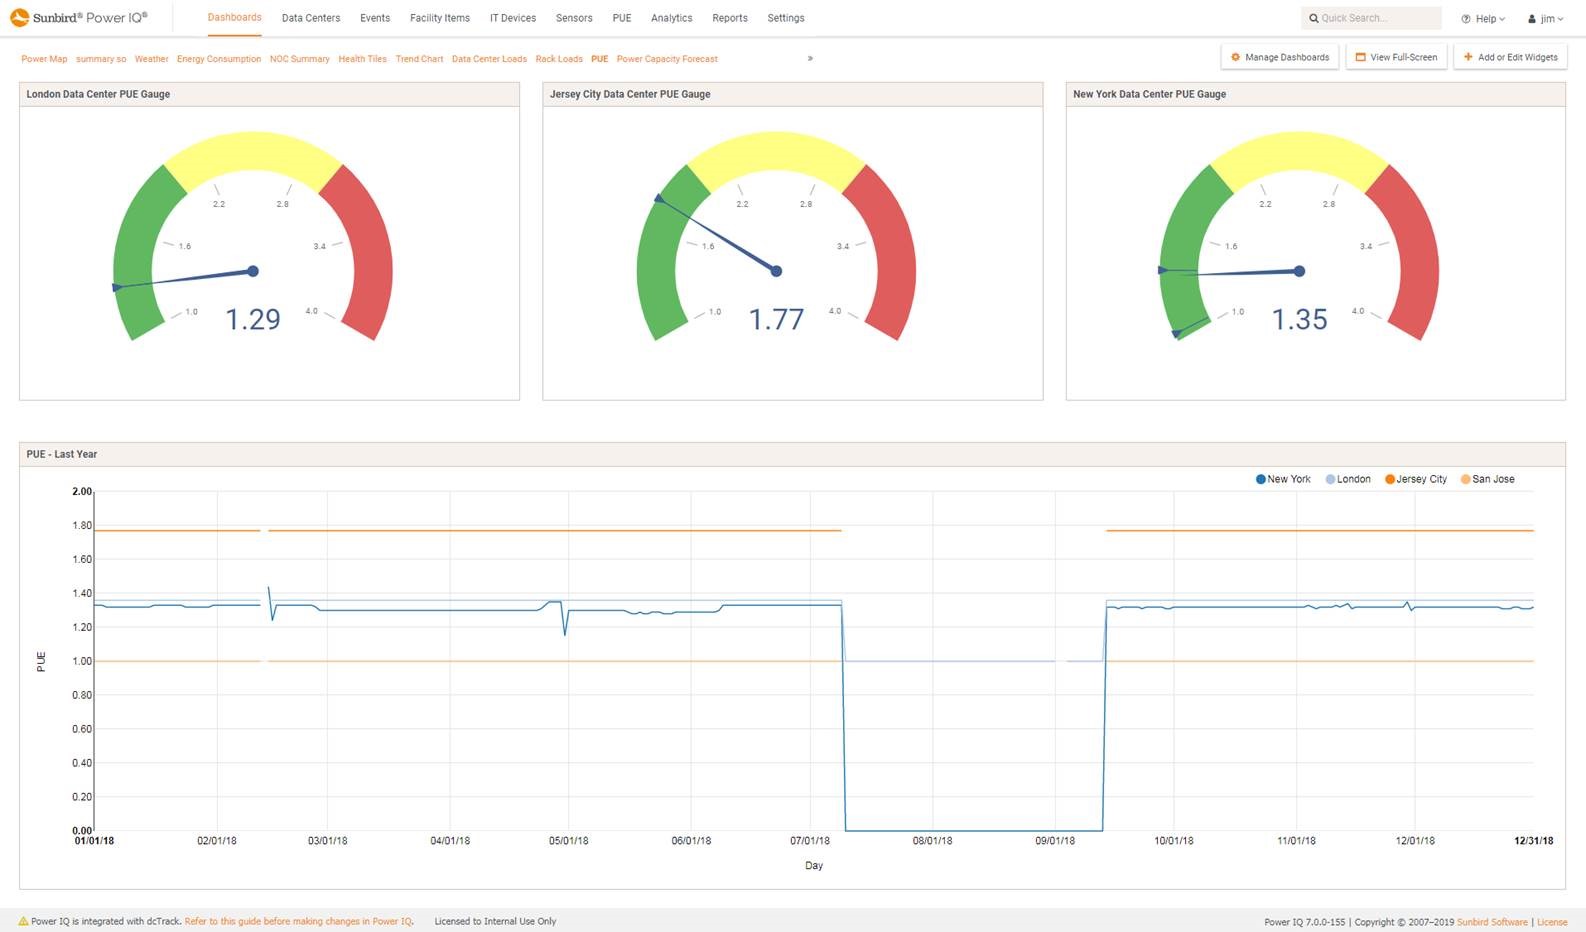
 Power IQ DCIM Monitoring | Power Management | Energy ManagementPUE Gauge and Trends