




























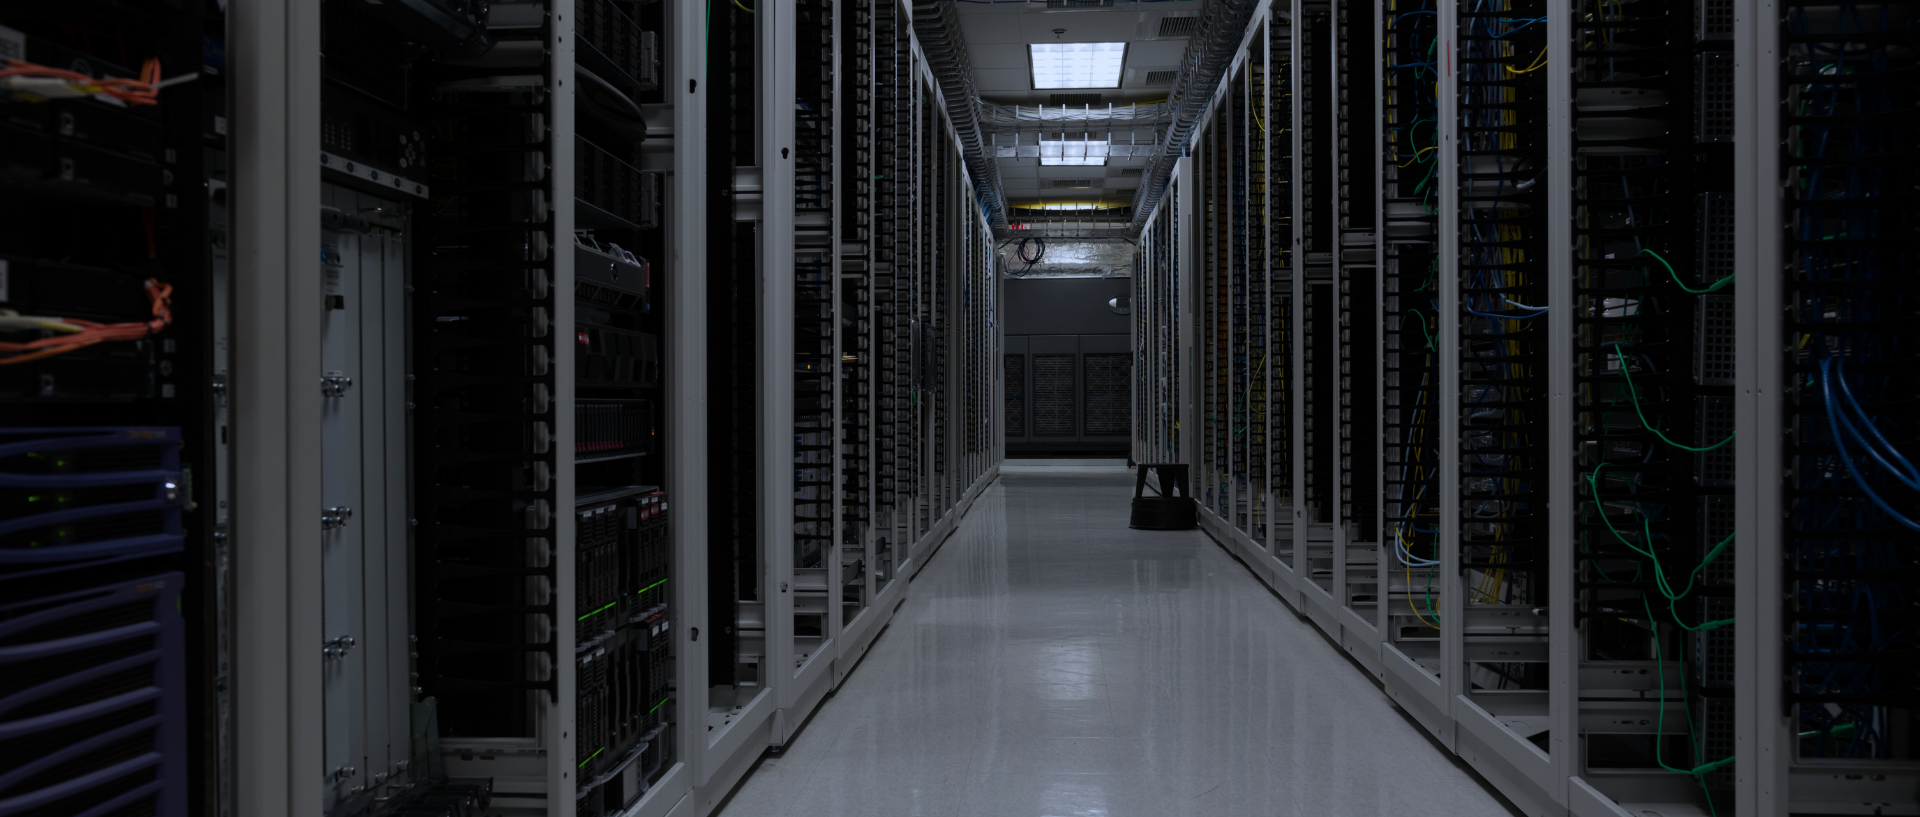
The Cost of Idle Resources in Your Data Center
Idle resources in your data center are a liability. Every unused server drawing power, every underutilized rack consuming cooling capacity, and every stranded port sitting dark on a switch represents money spent with no operational return.
That's always been true for traditional compute. It's even more consequential as organizations invest in GPU infrastructure for AI workloads, where the hardware is an order of magnitude more expensive and the cost of underutilization scales accordingly.
For data center managers under pressure to control costs, justify capital requests, and meet sustainability targets, understanding what idle resources actually cost—and why they accumulate—is the first step toward reclaiming operational efficiency and optimizing infrastructure expenditures.
Key Types of Idle Resources
Idle doesn't just mean powered-off equipment. In practice, idle resources take several forms, each with its own cost profile and root cause.
Zombie Servers
Zombie servers are physical machines that are powered on, connected to the network, and consuming power but running no active workloads. They're often the remnants of retired applications where the software was decommissioned but no one powered down the hardware. A typical zombie server draws 100–200 watts continuously—often consuming 30% to 40% of its maximum power configuration even when doing no work at all—and may go undetected for months or years without power utilization monitoring. Research from Stanford University and the Uptime Institute puts the zombie server population at around 30% of physical servers in enterprise environments. The cost isn't just electricity: zombie servers occupy rack space, consume cooling capacity, hold software licenses, and appear in power capacity allocations, reducing your available capacity across all resources simultaneously.
Underutilized Compute
Underutilized compute is subtler but equally wasteful. A server running at 5–8% average CPU utilization is idle by any practical measure, but it doesn't show up as a zombie server because there's technically a workload present. These are servers provisioned for peak demand that rarely or never arrives, or provisioned conservatively and never right-sized as workloads stabilized. Each one still consumes a full rack unit or more of space, its budgeted power draw, and its share of cooling. Across a large fleet, pervasive low utilization is a strong signal that consolidation opportunities exist and that space, power, and cooling are all operating far below their actual capacity.
Stranded Capacity
Stranded power and cooling capacity occurs when allocated capacity never gets used. A common pattern is: a team requests a 20 kW power allocation for a new deployment, the circuits get built out, and the project gets delayed or descoped. The allocation stays on the books, unavailable for other uses, and the infrastructure supporting it was sized and paid for based on a load that never materialized. That stranded capacity doesn't just waste the infrastructure investment, it distorts your capacity and utilization reporting, making the facility look closer to max capacity than it actually is and driving premature expansion decisions.
Each of these idle resource types has a different cost profile, but they share a common problem: you're paying for them whether they're doing work or not.
The Cost of Idle Resources
Power gets most of the attention in waste conversations, but the true cost of idle infrastructure spans power, space, and cooling simultaneously.
Start with power. The key misconception is that servers not doing work cost very little. In reality, an idle server draws roughly 30–40% of its peak power load. Take a conservative enterprise scenario: 200 zombie servers with a nameplate rating of 800 watts operating at an active idle load of 30% (240 watts). Running year-round at a conservative commercial electricity rate of $0.13/kWh, these 200 servers consume 420,480 kWh, translating to $54,662 per year in direct electricity costs. Factor in a standard enterprise PUE of 1.5 to account for cooling and facility overhead, and that figure jumps to $81,994 annually. Add software licensing fees that accrue on zombie servers regardless of whether they're doing useful work, and the waste extends well beyond the electricity bill.
Space and cooling compound the problem. In colocation, customers pay for allocated cabinet space whether it's occupied or not — at typical rates of $1,000 to $2,000 per cabinet per month, empty space shows up directly on the invoice. In enterprise facilities the math is less direct but equally real. Cooling is where idle space creates costs that aren't immediately obvious: CRAC and CRAH units don't scale linearly, so running at 30% load doesn't cost 30% of full-load power. Empty cabinet slots and unoccupied rows also disrupt hot-aisle/cold-aisle containment, forcing cooling systems to work harder to manage air in areas that don't need it.
The cumulative picture is what matters. A single underutilized server isn't just a power problem — it's consuming a rack unit, contributing to cooling load, holding a network port allocation, and occupying floor plan space. Across a population of idle or underutilized assets, the total cost of waste is considerably higher than any single metric suggests.
AI Workloads Raise the Stakes
Everything described above applies to traditional compute. But as organizations invest in dedicated GPU infrastructure for AI workloads, the idle resource problem gets significantly more expensive.
A traditional server might cost $10,000–$20,000 and draw 150 watts at idle. A GPU server configured for AI training such as an NVIDIA DGX H100 costs in the range of $300,000–$450,000 and draws around 1.8 kW at idle. At that price point, with a typical depreciation life of 36 months, the cost of underutilization is enormous. A GPU server that sits idle between training runs is burning through its capital value with nothing to show for it. The more time it spends idle, the higher the effective cost per productive training run, and that cost compounds quickly when jobs are infrequent or infrastructure is poorly scheduled.
The choice of training method compounds the utilization problem. Organizations that invest in GPU clusters for occasional full model training runs are paying for significantly more compute than the task requires, while leaving the infrastructure idle for longer periods between jobs.
For data center managers supporting AI initiatives, this creates a specific and urgent visibility requirement. It's not enough to know that GPU servers are powered on. You need to know whether they're running active training workloads, queued for inference, or sitting idle, and for how long. The same monitoring discipline that surfaces zombie servers applies directly to GPU clusters, with the dollar figures multiplied by an order of magnitude.
How to Identify Idle Resources with DCIM Software
The primary barrier to reclaiming idle resources isn't a lack of intent — it's a lack of reliable, current data. Spreadsheet-based tracking and static diagrams are always stale by the time someone looks at them. Systematically surfacing waste requires a real-time, unified view of power, space, cooling, and connectivity across the entire infrastructure. That's where Sunbird DCIM earns its value.
Automatic power budgeting eliminates one of the most common sources of stranded capacity: over-allocated power. The traditional approach is to derate a server's nameplate rating to around 70% and use that as its power budget—a method that is time-consuming, inaccurate, and wastes money. Sunbird automatically calculates an accurate power budget for each make and model instance based on its actual load in your environment running your applications. Customers like Comcast and eBay report improvements in power utilization of up to 40% after using this feature.
What-if analysis lets teams model the impact of planned changes before anything is physically touched. Before deploying new equipment or decommissioning existing assets, Sunbird simulates the effect on rack space and power, showing whether current, underutilized capacity can absorb the project or whether expansion is genuinely necessary.
Intelligent capacity search with model templates solves the fragmentation problem that makes idle capacity hard to use even when it exists. Using equipment templates with pre-defined requirements, Sunbird lets you quickly search for the optimal cabinet to deploy new equipment and returns a list of every cabinet with the available space, power, and connectivity to support it.
Ghost server reports automate the detection of idle servers. At the click of a button, Sunbird identifies every server drawing below a defined power threshold over a set time period. You can then inspect the minimum, maximum, and average power consumption per server to confirm ghost server candidates, tally the total kWh being wasted, and calculate exactly how much you'll save by removing them.
Built-in intelligence across the full power path addresses a visibility gap that creates stranded capacity at multiple levels of the power circuit. A server's power draw sits at the end of a chain running from the utility feed down through UPS systems, transformers, switchgear, UPS units, floor PDUs, and rack PDUs to the individual device. Sunbird tracks capacity and utilization at every hop in that chain, monitors three-phase power balance, and tracks circuit breaker states in real time. This gives operators the ability to push utilization closer to true capacity limits while maintaining the redundancy requirements needed to protect uptime.
Visual capacity reports with multi-parameter correlation replace the single-metric view that makes idle resources easy to miss. Sunbird provides holistic 2D and 3D views of rack capacity across space, power, cooling, and weight simultaneously — visualizing underutilized or unevenly distributed resources so teams can make more informed decisions that improve utilization and efficiency across the whole floor, not just one dimension at a time.
Zero-configuration dashboards for key resources like space, power, cooling, and data/power ports are included out of the box. By transforming data into health and capacity information and enabling teams to filter, sort, and trend historical data with a click, operators can quickly pinpoint underutilized resources and stranded capacity before it becomes a costly problem.
Real-World Case Studies
The cost of idle resources isn't theoretical. Two Sunbird customers — one of the largest cable operators in the US and one of the world's leading networking companies — have quantified what reclaiming stranded capacity is actually worth.
Comcast: 40% More Capacity From Existing Resources
Before deploying Sunbird, Comcast was using conservative, nameplate-based power budgets for its servers — a standard practice that systematically over-allocates power and quietly locks capacity away from other uses. With Sunbird's Auto Power Budget, which calculates an accurate operational power budget for each server based on its actual measured load, Comcast discovered that its existing facilities had significantly more usable capacity. The result was 40% more utilization out of existing resources.
Cisco: $40,000 Saved Per Month Through Colo Consolidation
Without centralized visibility into actual colo space usage and power consumption, Cisco was carrying underutilized power contracts and stranded capacity it couldn't see or act on. After deploying Sunbird DCIM, Cisco gained the visibility to model consolidation scenarios, identify cages that could be merged, and safely redistribute workloads based on measured power rather than estimates. At one site alone, Cisco consolidated three cages down to one, eliminating recurring contracts they no longer needed. That consolidation saves $40,000 per month with four additional consolidation and migration efforts underway carrying comparable savings potential.
Bringing It All Together
Idle resources in a data center are not inevitable — they're the result of poor visibility, reactive provisioning habits, and processes that don't close the loop on decommissioned infrastructure. The costs are real and ongoing: wasted power, stranded capital, and capacity planning decisions made on incomplete information.
For data center managers, the opportunity is the same whether the underutilized asset is a $10,000 conventional server or a $400,000 GPU node: get visibility into what you have, measure what it's actually doing, and build the operational discipline to act on what you find. The savings are already sitting in your facility, and at AI infrastructure price points, they're larger than ever.
Want to see for yourself how Sunbird DCIM can help you increase the efficiency of resource utilization in your data center? Get your free test drive today.